- XRP stuck within a triangle on the short term chart.
- Range breakout may co-incide with the sell-off in others.
XRP the second largest cryptocurrency by market cap, is consolidating in a triangle after a comparatively milder sell-off that saw prices falling by nearly 20 percent in the month of Novemeber, a meagre figure compared to Bitcoin’s 37 percent crash.
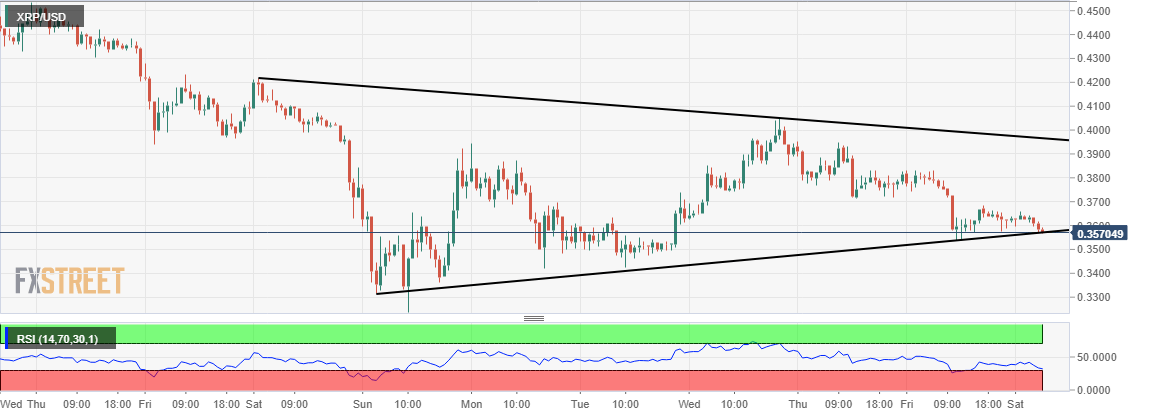
XRP/USD is down nearly 2 percent on day at $0.3566 and trading in a more than 3 percent range for the day. On the hourly chart, XRP has got itself consolidating in a triangle after last month’s sell-off and the break out of this triangular range may co-incide with the sell-off in other cryptocurrencies, which may mean even XRP would be pressured to the downside.
For now, it is sitting exactly at the support of the lower end of the triangle and a break right away would be bearish for the prices. Next support is placed around $0.32.
XRP/USD 60-minute chart: