- Ripple’s XRP price is trading in the red by some 1.90% in the session on Friday.
- XRP/USD price action remains bearish, with further moves lower still eyed, given technical behaviour.
- The next major area to the downside is seen at $0.1500, should the $0.1800 give way to the bears.
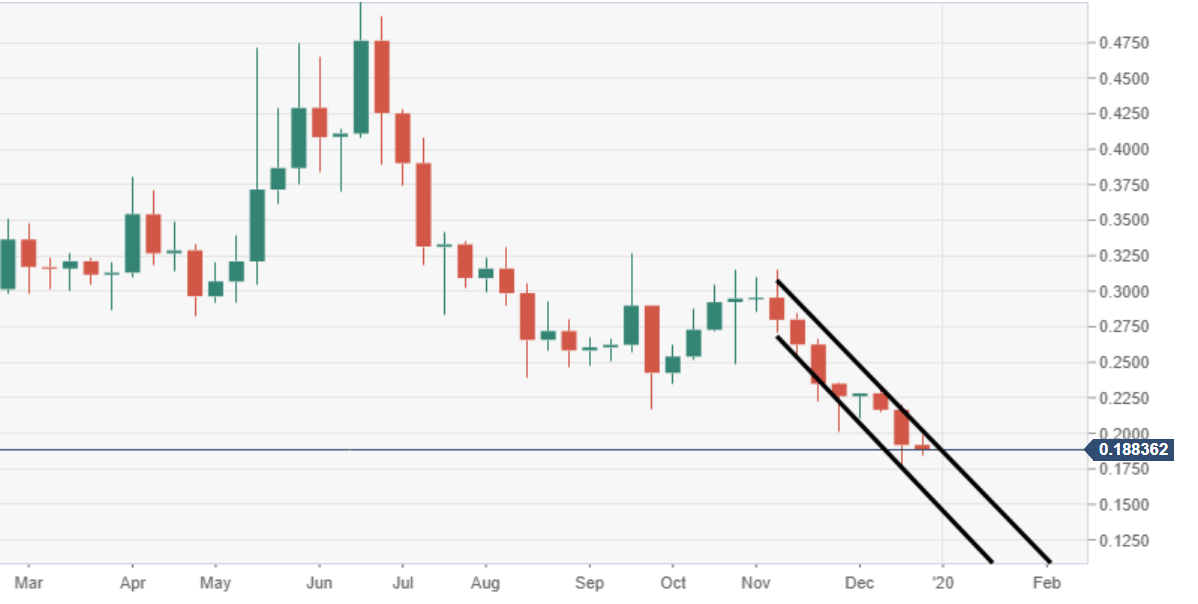
XRP/USD weekly chart
The price has been on the decline for going on eight weeks, having dropped as much as 45%.
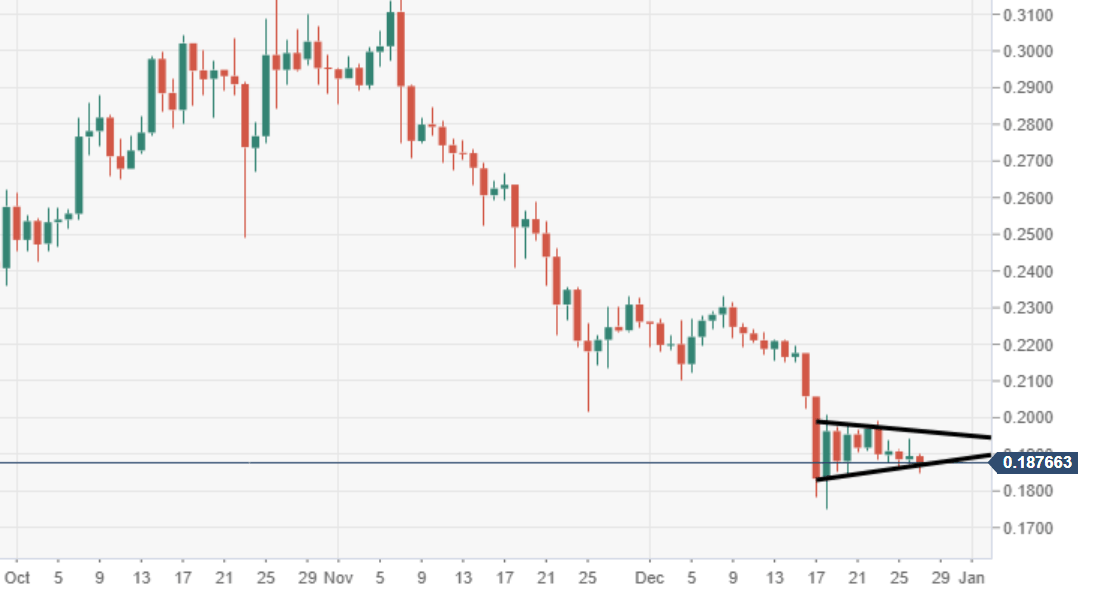
XRP/USD daily chart
Price action via the daily chart view is moving within a bearish pennant pattern, subject to a breakout south.
Spot rate: 0.1875
Relative change: -1.00%
High: 0.1902
Low: 0.1846
