- XRP price on Thursday is weighted to the downside, trading in negative territory by 3.5%.
- XRP/USD price action is being within an extremely narrowing range, which suggests of further vulnerabilities.
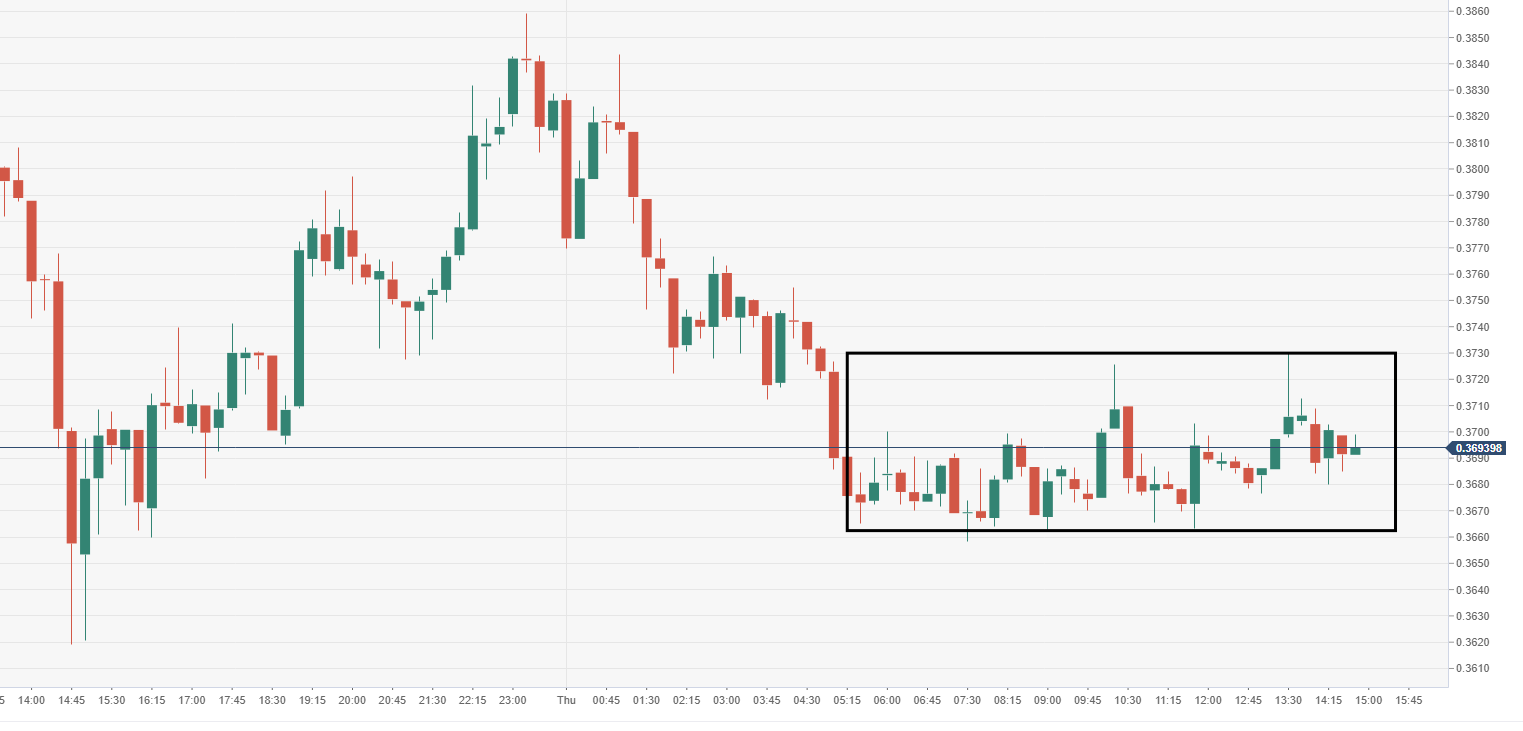
XRP/USD 15-minute chart
- Price action is narrowing greatly which spells further potential danger, within near-term range-block.
Spot rate: 29.90
Relative change: -3.22%
High: 32.25
Low: 29.78
Trend: Bearish
Support 1: 0.3636, daily pivot point support.
Support 2: 0.3447, daily pivot point support.
Support 3: 0.3275, daily pivot point support.
Resistance 1: 0.3998, daily pivot point resistance.
Resistance 2: 0.4171, daily pivot point resistance.
Resistance 3: 0.4360, daily pivot point resistance.
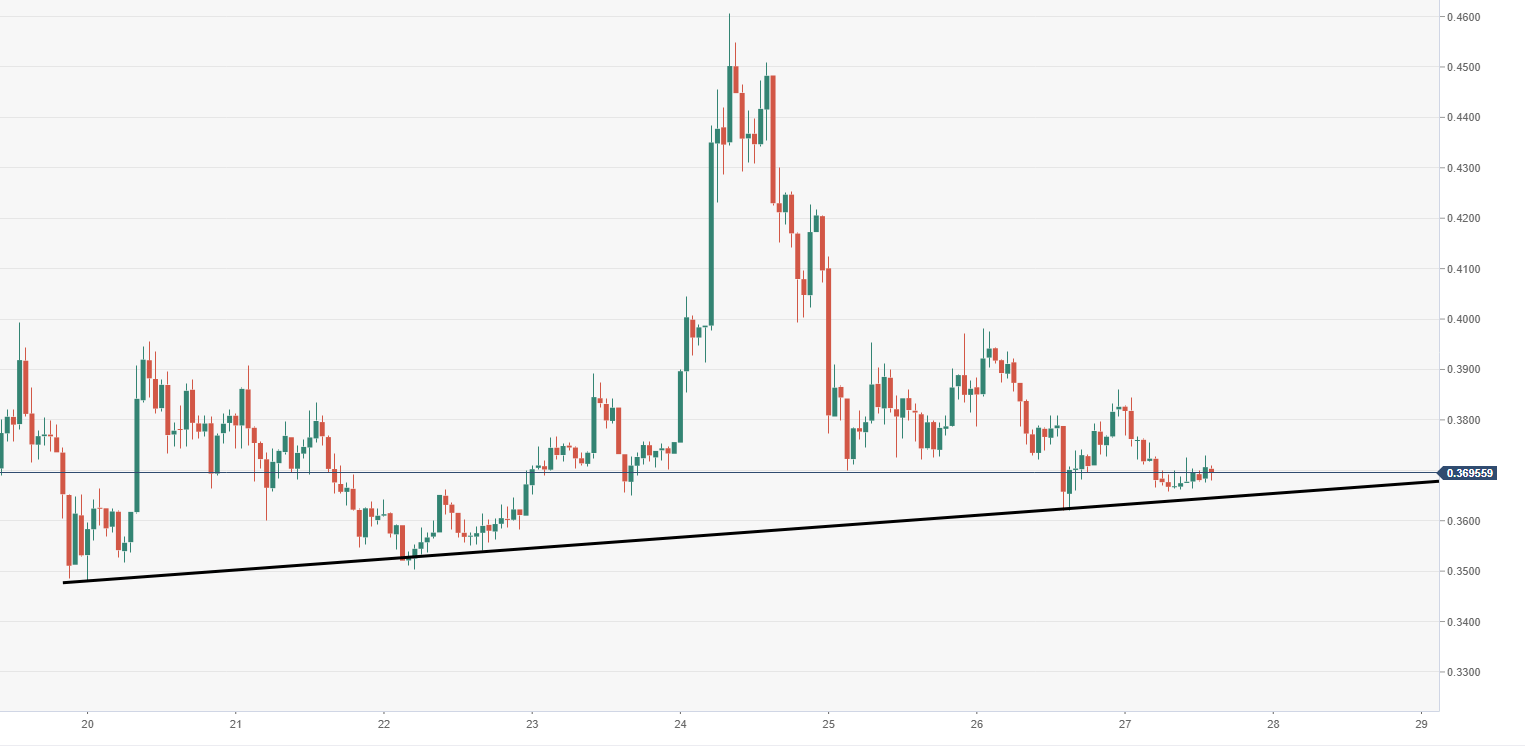
XRP/USD 60-minute chart
- The price is being supported near-term by an almost horizontal trend line, which is gradually being tested by the bears, subject to a breach.
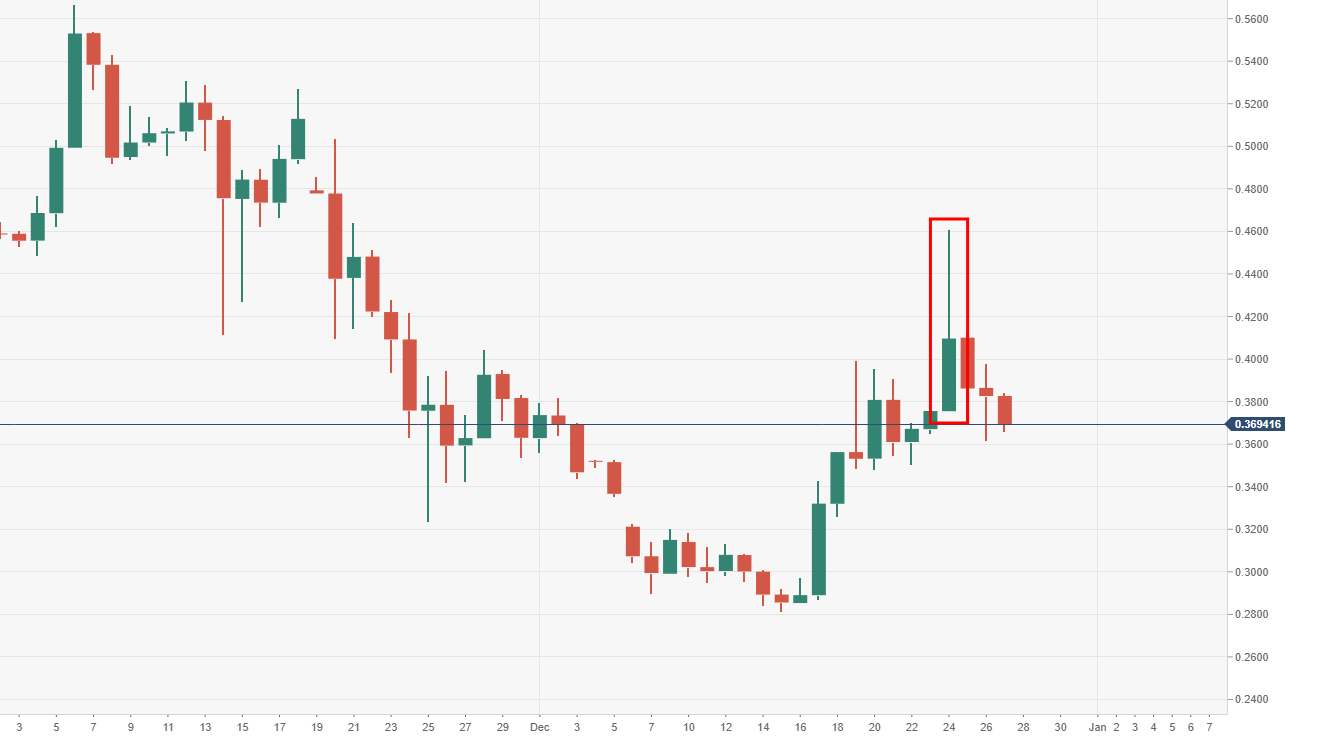
XRP/USD daily chart
- Candlestick on the 24th December produced a long upper wick, quick reversal of initial upside, demonstrates bearish qualities.