- Ripple’s XRP price is trading in the red by some 1.00% in the session on Thursday.
- XRP/USD price action is moving within another bearish technical structure, which would suggest further moves south.
- Should another wave of downside pressure be observed then eyes will be on $0.1500.
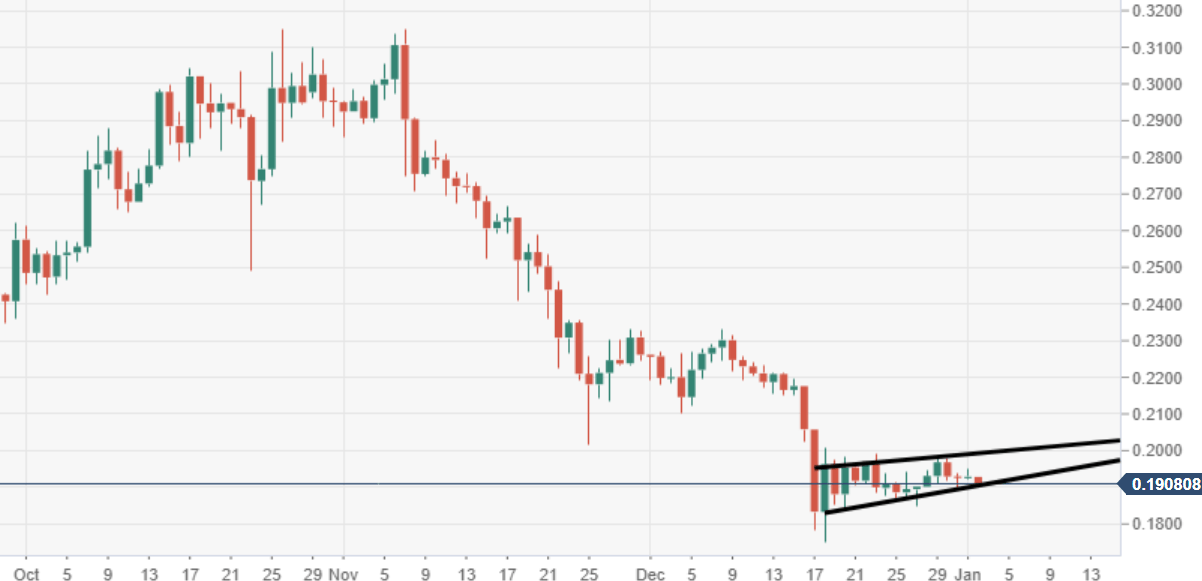
XRP/USD daily chart
Price action is narrowing within a bearish pennant structure via the daily chart view, potential breakout south is eyed.
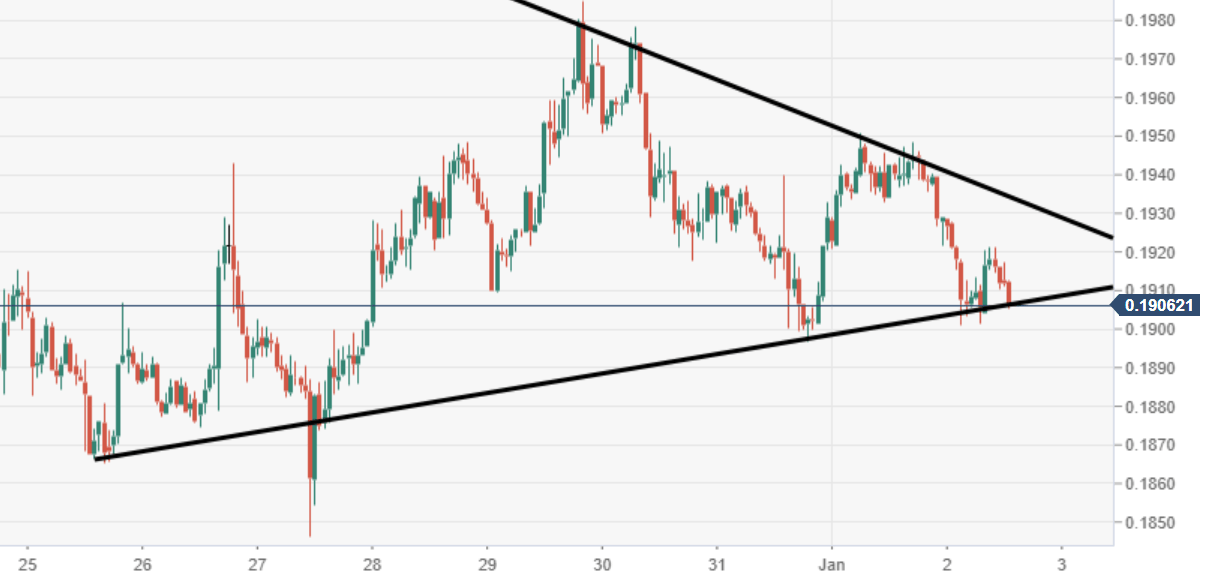
XRP/USD 60-minute chart
A near-term ascending trend line is being tested to the downside by the market bears, a breach could invite another wave of selling.
Spot rate: 0.1900
Relative change: -1.00%
High: 0.1928
Low: 0.1900
