- Ripple’s XRP price nursing losses of around 2.5% in the second half of the session on Monday.
- XRP/USD price behavior continues to demonstrate some downside vulnerabilities.
XRP/USD 15-minute chart
- The price is moving within an ascending wedge pattern formation, subject to a breakout to the downside.
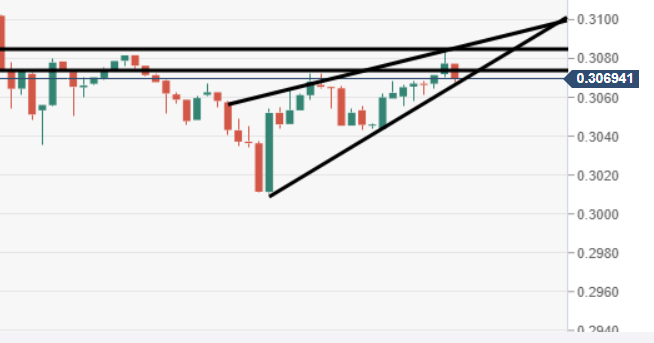
Spot rate: 0.3066
Relative change: -2.53%
High: 0.3147
Low: 0.3010
Trend: Bearish
Trends:
Daily SMA20: 3759.18
Daily SMA50: 3619.45
Daily SMA100: 3722.48
Daily SMA200: 5085.35
Levels:
Previous Daily High: 3818.37
Previous Daily Low: 3764.23
Previous Weekly High: 4187.25
Previous Weekly Low: 3659.1
Previous Monthly High: 4187.25
Previous Monthly Low: 3338.98
Daily Fibonacci 38.2%: 3784.91
Daily Fibonacci 61.8%: 3797.69
Daily Pivot Point S1: 3761.72
Daily Pivot Point S2: 3735.9
Daily Pivot Point S3: 3707.58
Daily Pivot Point R1: 3815.86
Daily Pivot Point R2: 3844.18
Daily Pivot Point R3: 3870
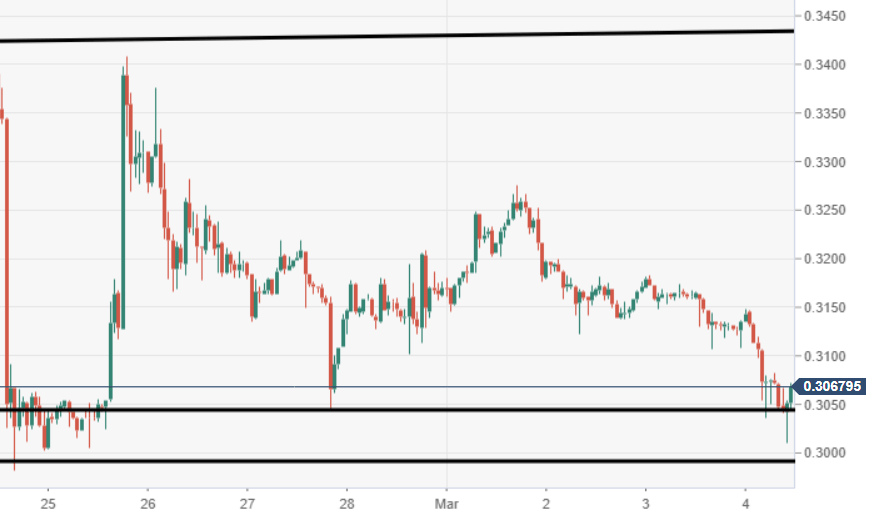
XRP/USD 60-minute chart
- Big near-term buying protecting the psychological $0.3000 price mark.
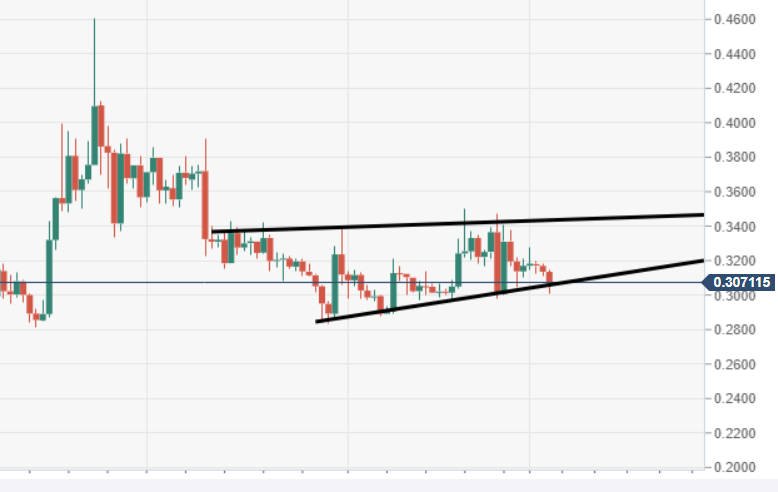
XRP/USD daily chart
- Price action moving within the confinements of a wedge/pennant pattern, subject to downside risks.