- Ripple’s XRP price has bullish momentum kicked back into it, jumping some 3% in the second half of the session.
- XRP/USD big buyers come into play at the lower part of the recent daily trading range.
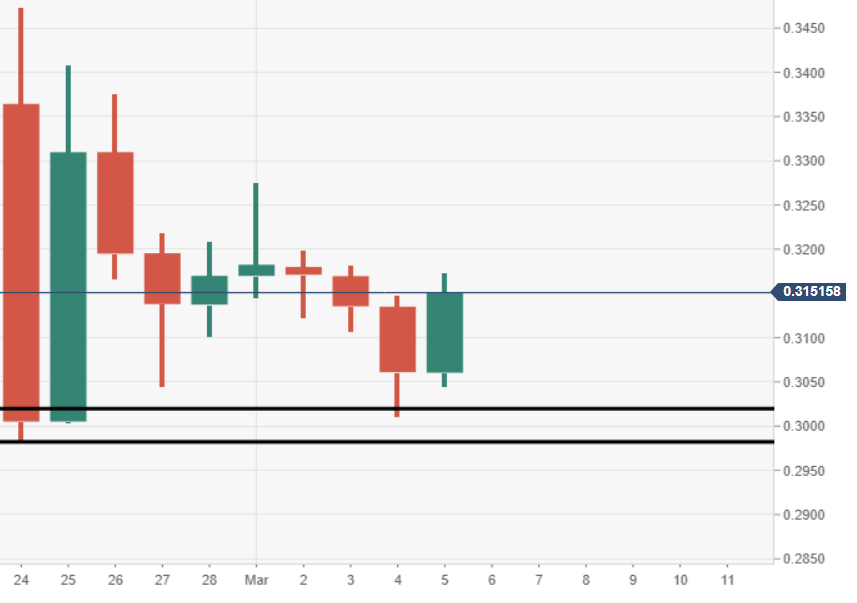
XRP/USD 15-minute chart
- Price action breaking out to the upside at session highs, buying kicked in at the low of current daily trading range-block.
Spot rate: 0.3152
Relative change: +3.30%
High: 0.3173
Low: 0.3044
Trend: Bullish
Trends:
Daily SMA20: 0.3159
Daily SMA50: 0.3138
Daily SMA100: 0.3318
Daily SMA200: 0.3782
Levels:
Previous Daily High: 0.3148
Previous Daily Low: 0.3011
Previous Weekly High: 0.3473
Previous Weekly Low: 0.2983
Previous Monthly High: 0.3505
Previous Monthly Low: 0.2879
Daily Fibonacci 38.2%: 0.3063
Daily Fibonacci 61.8%: 0.3096
Daily Pivot Point S1: 0.2998
Daily Pivot Point S2: 0.2936
Daily Pivot Point S3: 0.2861
Daily Pivot Point R1: 0.3136
Daily Pivot Point R2: 0.321
Daily Pivot Point R3: 0.3273
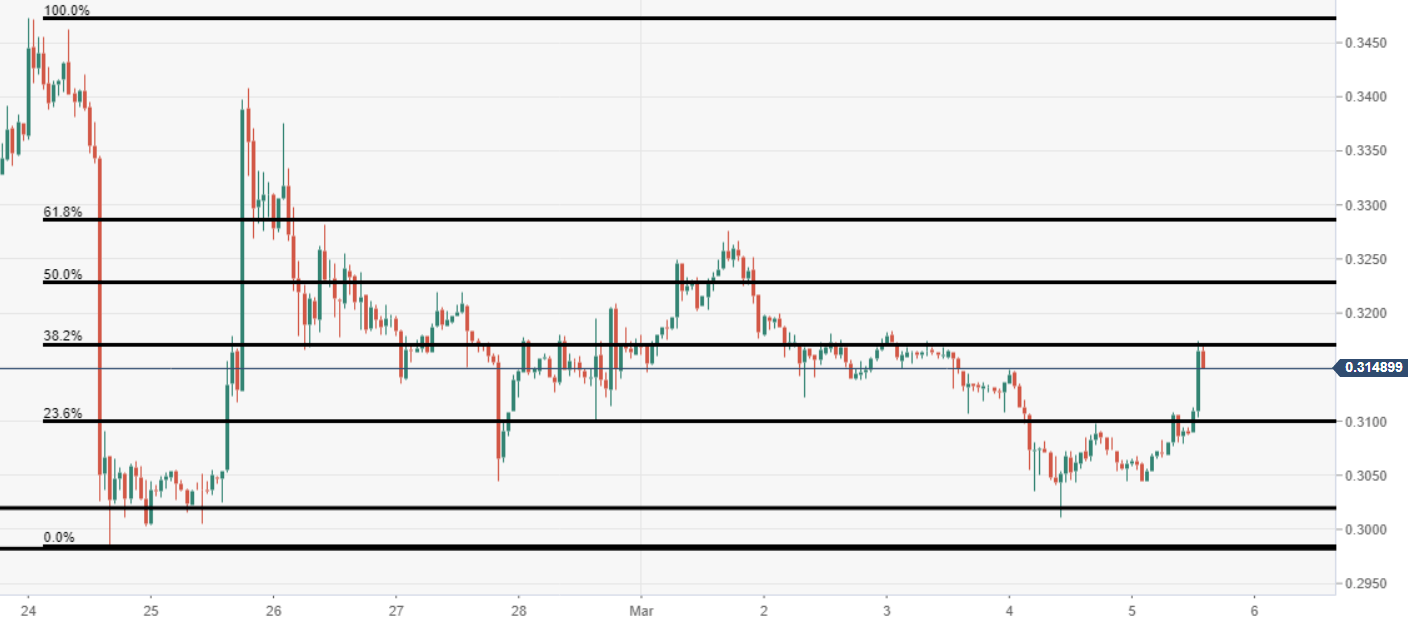
XRP/USD 60-minute chart
- Rejection at the 38.2% Fibonacci observed via the 60-minute chart view.
XRP/USD daily chart
- Buyers heavily protect the $0.3000 price region, after renewed life came into play at these depressed levels.