- Ripple’s XRP price is trading down with losses of some 4.20% in the session on Thursday.
- XRP/USD bulls failed to breakdown the chunky barrier of resistance around the $0.2800-0.2900 area.
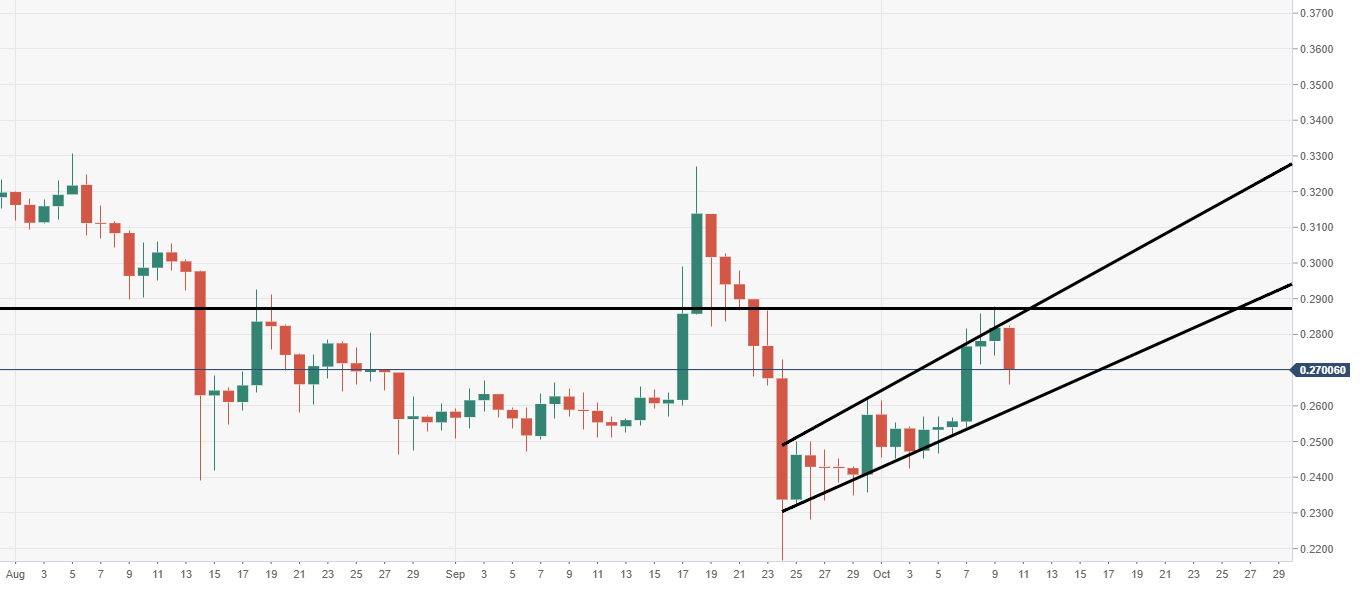
- Price action can be seen moving within an ascending channel structure, which could be also viewed as a bearish flag.
XRP/USD daily chart
The bulls so far have faltered at the barrier of $0.2800-0.2900, which could prove to be a problem by inviting sellers to come into play.
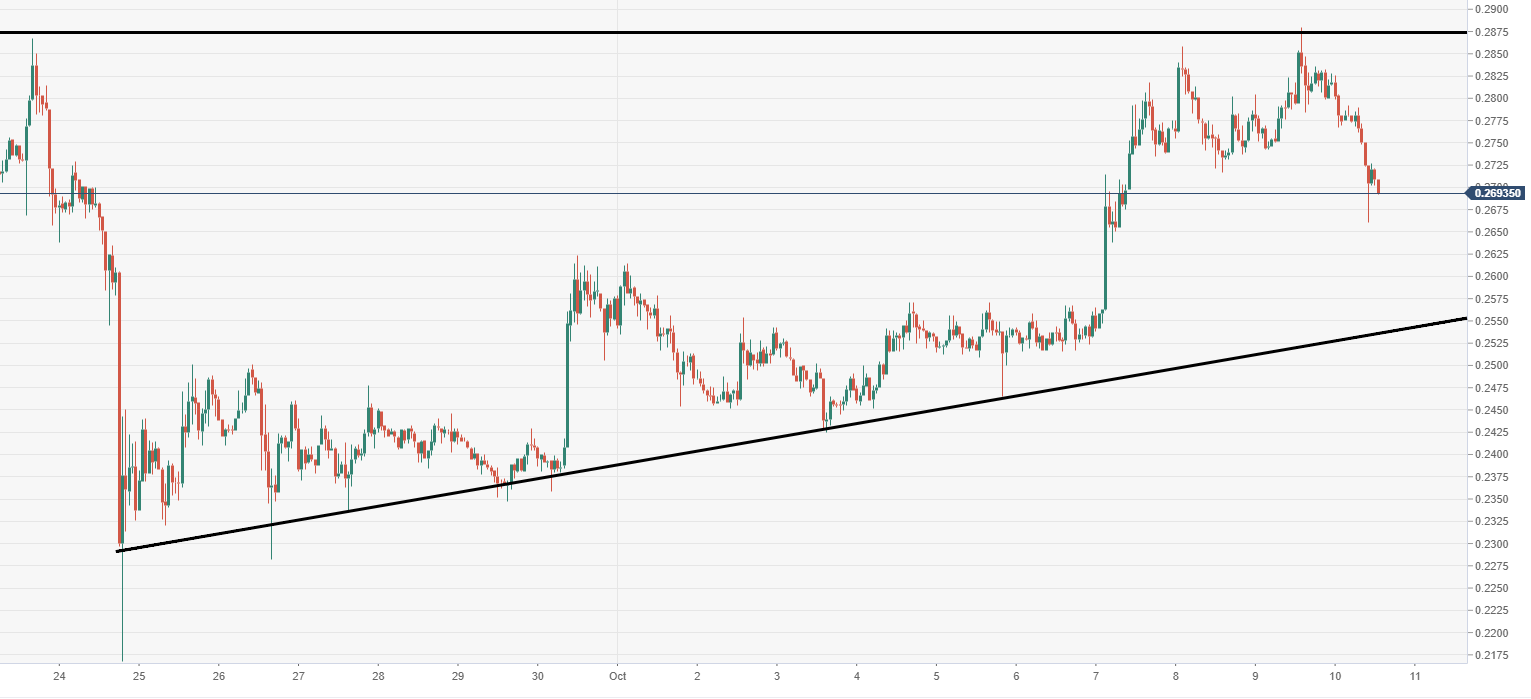
XRP/USD 60-minute chart
Support will likely be sought below at the ascending trend line seen via the 60-minute.
Spot rate: 0.2815
Relative change: -4.20%
High: 0.2825
Low: 0.2660
