- Ripple’s XRP price trading down some 0.70% in the second half of the session on Thursday.
- XRP/USD managed to close just outside of a triangular pattern via the daily. The bulls have an opportunity to drive the price higher given the escape.
Spot rate: 0.3141
Relative change: -0.70%
High: 0.3190
Low: 0.3129
Trends:
Daily SMA20: 0.3165
Daily SMA50: 0.3116
Daily SMA100: 0.3265
Daily SMA200: 0.3776
Levels:
Previous Daily High: 0.3268
Previous Daily Low: 0.3087
Previous Weekly High: 0.3236
Previous Weekly Low: 0.3011
Previous Monthly High: 0.3505
Previous Monthly Low: 0.2879
Daily Fibonacci 38.2%: 0.3199
Daily Fibonacci 61.8%: 0.3156
Daily Pivot Point S1: 0.3079
Daily Pivot Point S2: 0.2993
Daily Pivot Point S3: 0.2898
Daily Pivot Point R1: 0.3259
Daily Pivot Point R2: 0.3354
Daily Pivot Point R3: 0.344
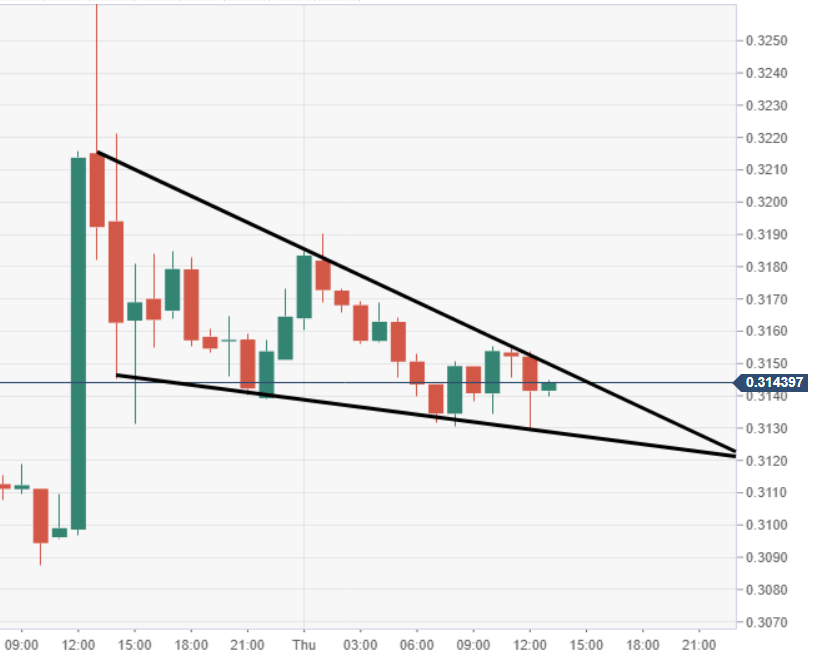
XRP/USD 60-minute chart
- XRP/USD price action is moving within a descending wedge pattern formation, subject to potential breakout to the upside.
XRP/USD daily chart
- Price action on Wednesday managed to force a daily closure just above a triangular structure that had been containing upside.
- Current daily candlestick is sitting just above the mentioned pattern, leaving door open to further potential upside.

