- Ripple’s XRP price is trading in the red by some 1.90% in the session on Tuesday.
- XRP/USD price action is moving within another bearish technical structure, which would suggest further moves south.
- The next major area of safety to the downside remains at $0.1500.
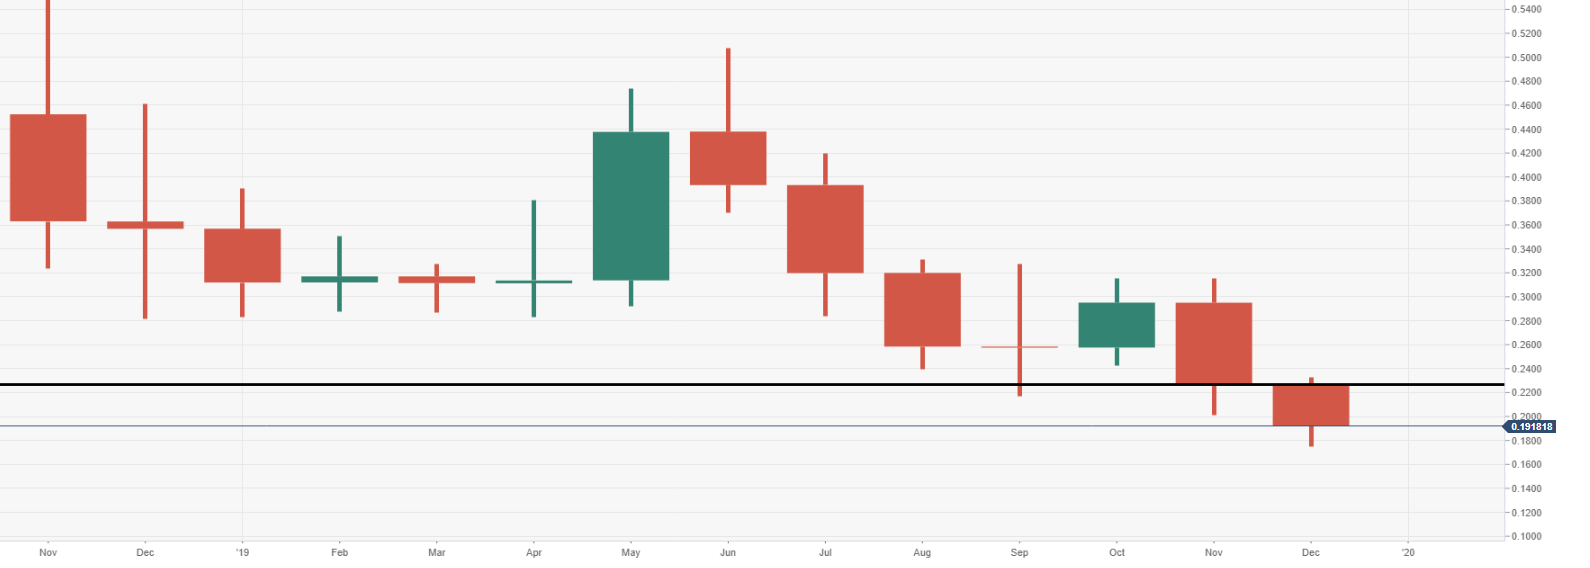
XRP/USD monthly chart
The price is set for another closure on the month in the red, it markets two consecutive now. As XRP heads into the new year stuck within a bearish trend, with little signs of that changing anytime soon for now. The price is sitting below critical monthly support at $0.2300.
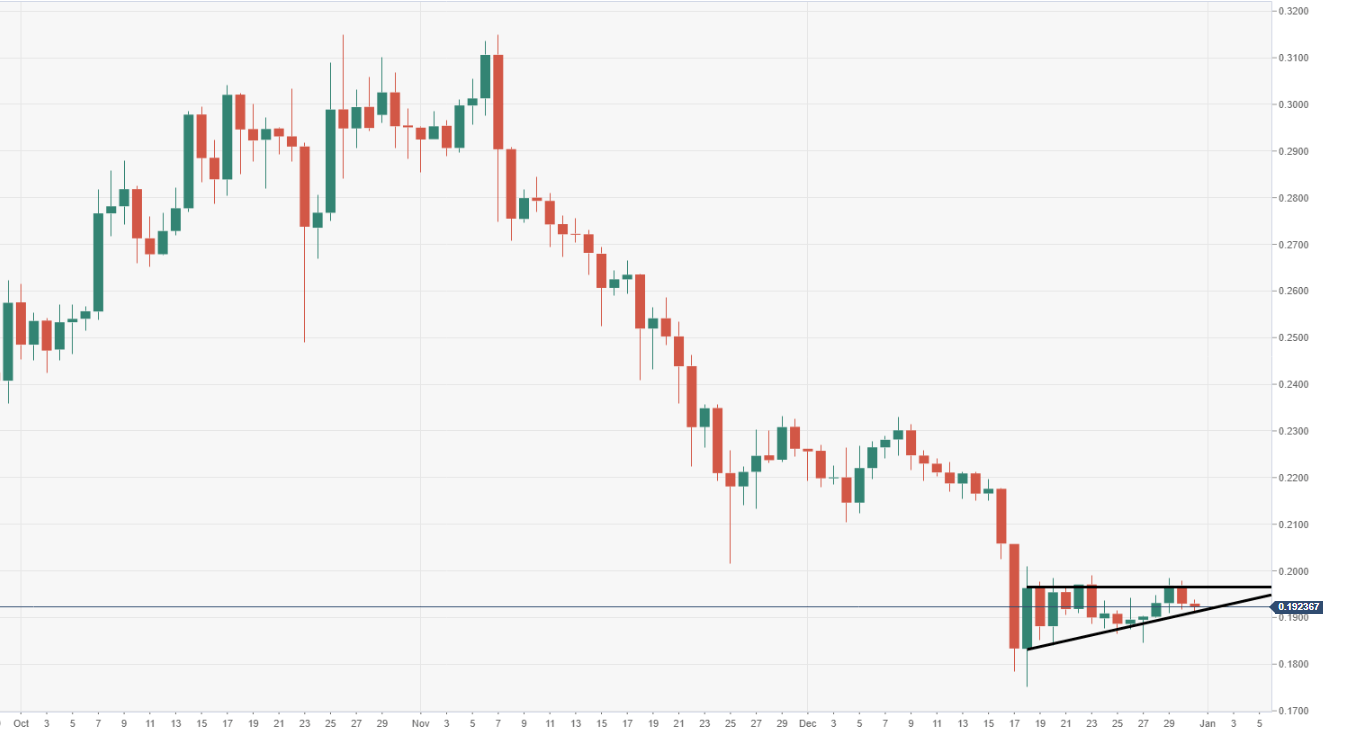
XRP/USD daily chart
Price action is moving within a bearish pennant via the daily, subject to a potential breakout south.
Spot rate: 0.1918
Relative change: -0.50%
High: 0.1937
Low: 0.1913
