- Ripple’s XRP price was trading down heavily on Thursday, over 6% in the latter part of the session.
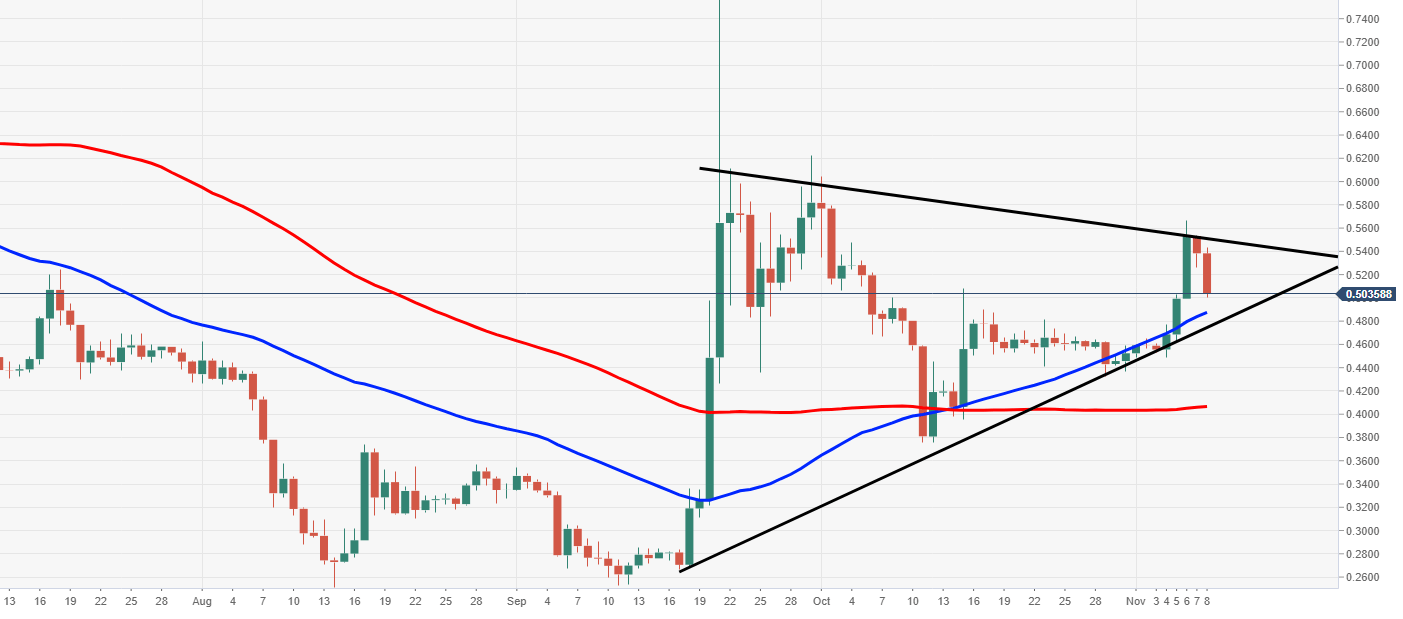
- XRP/USD saw a big daily rejection by an upper descending trend line, firm eyes on support around $0.5000 area.
- Further south, ascending trend line on the daily, tracking at $0.4800, a failure to hold here could be catastrophic.
XRP/USD daily chart
Spot rate: 0.5037
Relative change: -6.43%
High: 0.5437
Low: 0.5013
Trend: Bearish
Support 1: 0.5000, big psychological area of support.
Support 2: 0.4981, daily pivot point support.
Support 3: 0.4800, ascending daily trend line.
Resistance 1: 0.5525, daily pivot point resistance & upper trend line.
Resistance 2: 0.5667, daily pivot point resistance, 6th November high.
Resistance 3: 0.5797, daily pivot point resistance, 2nd October high.
