- Ripple’s XRP seen down just over 1% in the session on Thursday, within a form of consolidation.
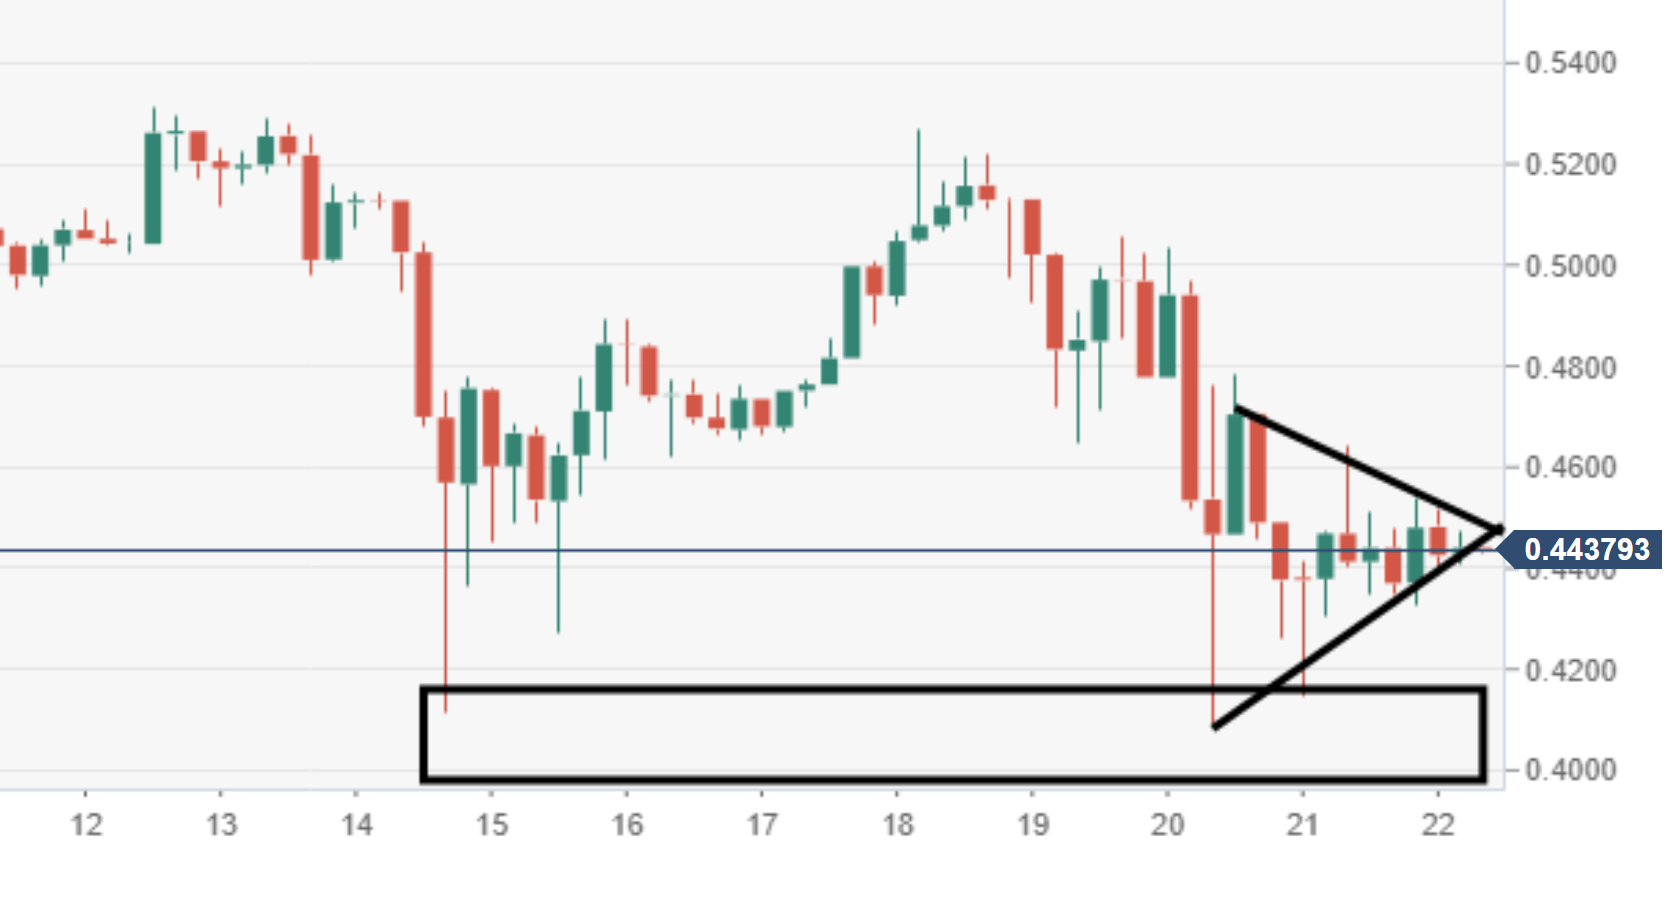
- XRP/USD price action has formed a bearish pennant pattern, which is subject to another breakout to the downside.
- Key near-term support levels should be noted at $0.4400 and then 0.4100-0.4000.
XRP/USD 60-minute chart
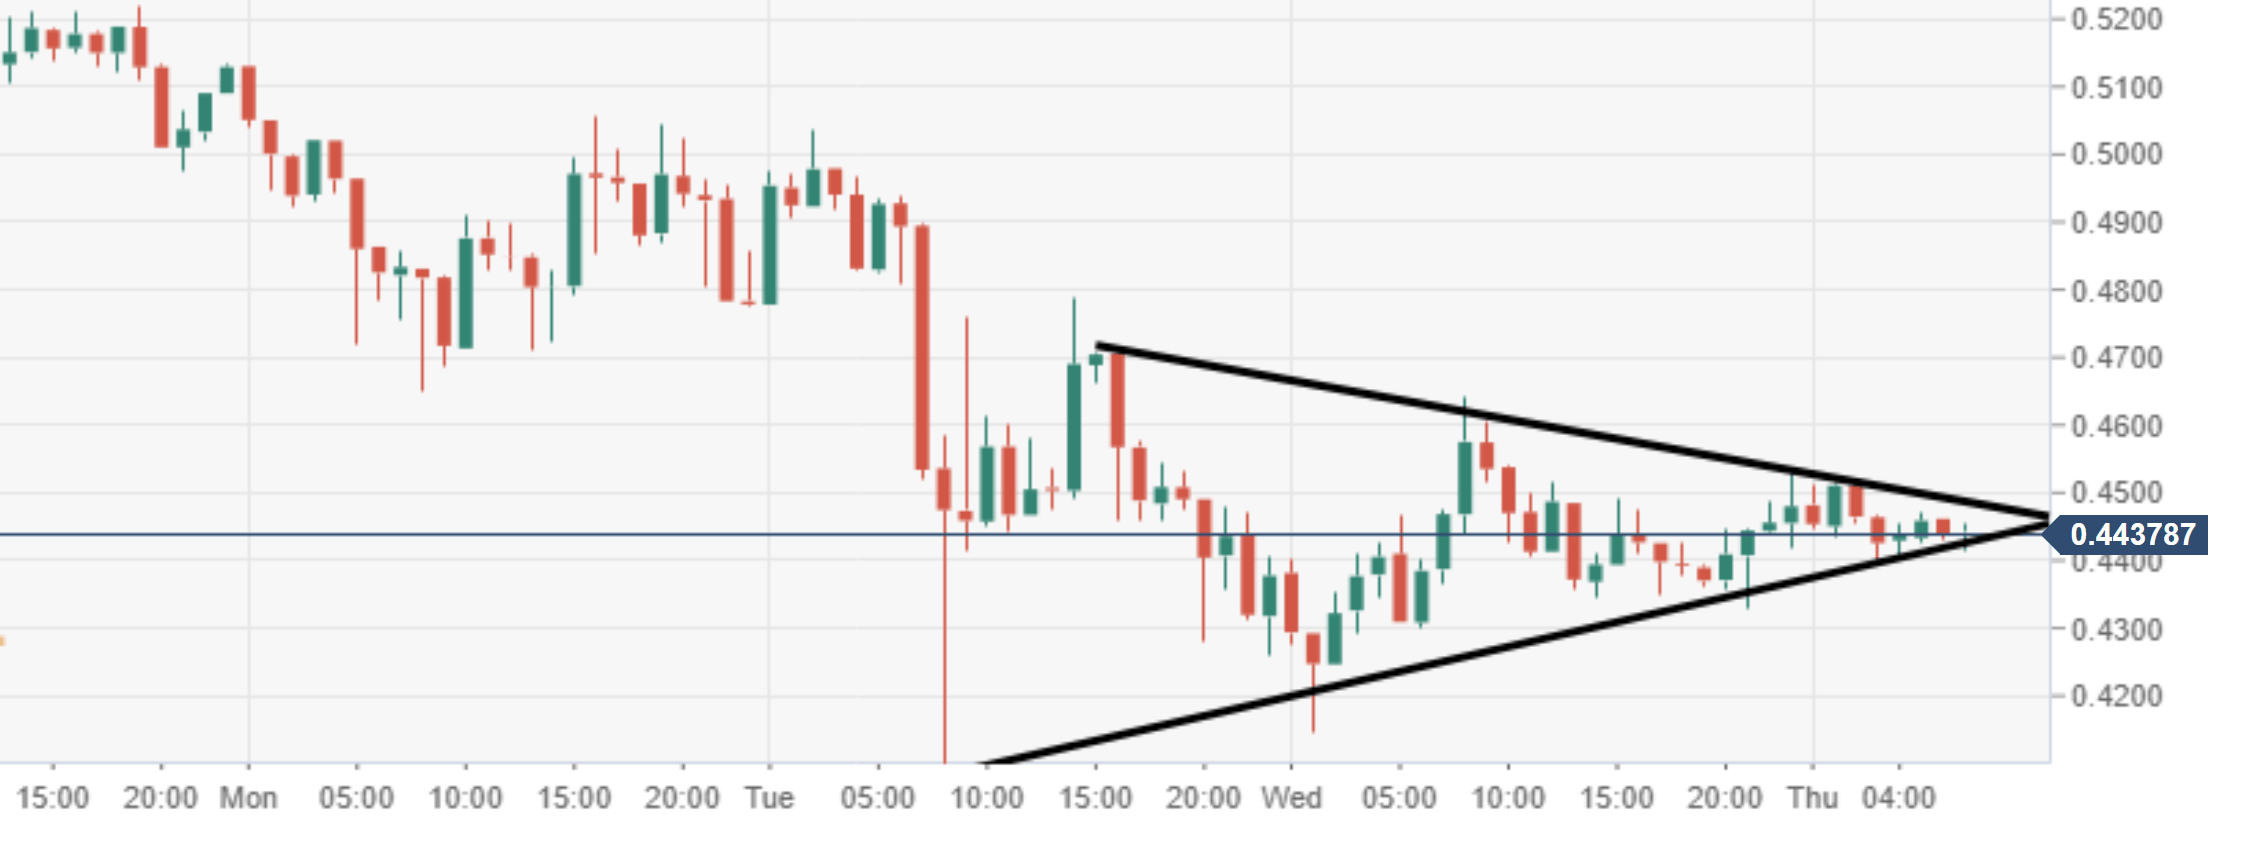
Spot rate: 0.4437
Relative change: -1.19%
High: 0.4641
Low: 0.4146
Trend: Bearish
Support 1: 0.4400, lower trend line of pennant.
Support 2: 0.4204, daily pivot point support.
Support 3: 0.3927, daily pivot point support.
Resistance 1: 0.4492, upper trend line of pennant.
Resistance 2: 0.4699, daily pivot point resistance.
Resistance 3: 0.4917, daily pivot point resistance.
XRP/USD 4-hour chart view
- Vulnerabilities shown here, a potential breakout could be seen forcing a retest of vital demand zone around $0.4100-0.4000.