- Silver prices stretch the early-week pullback from $18.39.
- 61.8% Fibonacci retracement, the channel support might question further downside.
- A descending trend line from September 2019 becomes the key upside barrier.
While printing three-day losing streak from the highest levels since late-February, probed on Monday, Silver prices drop to $17.60 during early Thursday.
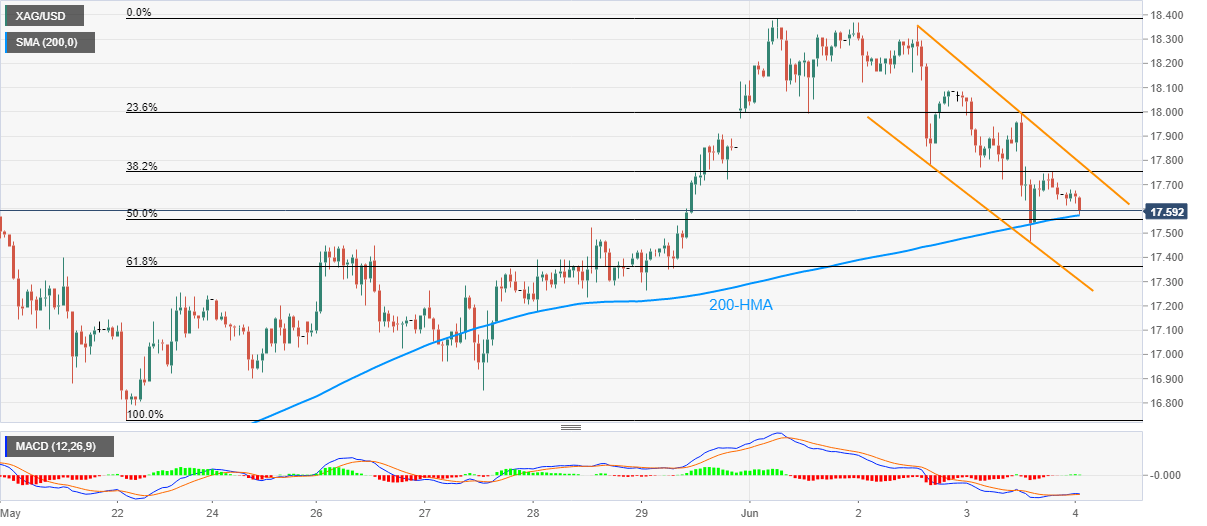
In doing so, the white metal tests the 200-HMA support level of $17.57 while staying inside a short-term descending trend channel formation.
Should the bears refrain from respecting $17.57 support, 61.8% Fibonacci retracement of its May 22 to June 01 upside, near $17.36, followed by the said channel’s lower line around $17.30, could restrict further downside.
Alternatively, the bullish MACD signals and strong support increase the odds of the bullion’s break of the channel formation by crossing $17.80 immediate resistance.
Should that happen, $18.10 and the recent high near $18.40 could lure the buyers ahead of diverting them to a multi-week falling trend line near $18.55.
Silver hourly chart
Trend: Pullback expected
