- Silver prices struggle to keep upside momentum from 61.8% Fibonacci retracement of August 25 to September 01 upside.
- Monthly top, $29.85 question the bulls targeting $30.
- Late-August bottom near $26 adds to the downside barriers.
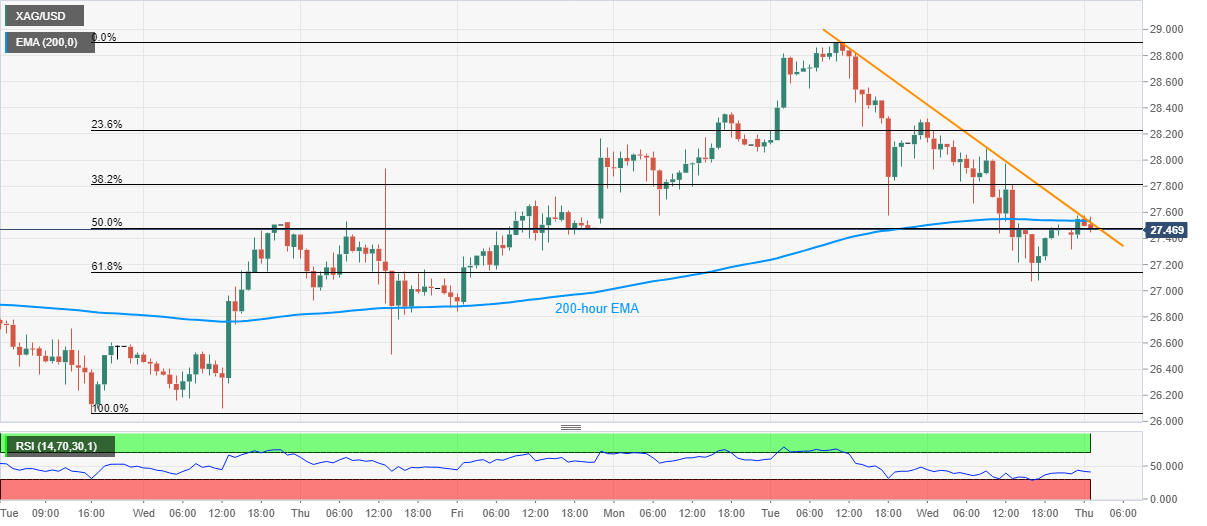
Silver keeps recovery moves from $27.07 while taking rounds to $27.50 during the early Thursday. The white metal marked the heaviest losses in two weeks the previous day before bouncing off the key Fibonacci retracement level. However, 200-hour EMA and a falling trend line from Tuesday questions the pair’s further rise around $27.50/55.
Considering the metal’s sustained trading above 61.8% of Fibonacci retracement amid normal RSI conditions, the quote is likely to cross the immediate resistance confluence, which in turn can recall $28.30 and the weekly top surrounding $28.90.
Even so, bulls will find it difficult to keep the reins as $29.00 round-figures and the previous month’s high near $29.85 can challenge run-up to the $30.00 threshold.
Meanwhile, the pair’s downside past-61.8% Fibonacci retracement level of $27.14 will need a clear break of $27.00 round-figures to revisit the area comprising multiple lows marked during April 20-26 near $26.05-00.
Silver hourly chart
Trend: Pullback expected
