- Silver remained confined in a narrow range through the first half of the trading action on Friday.
- Neutral technical indicators on the daily chart warrant caution before placing fresh bearish bets.
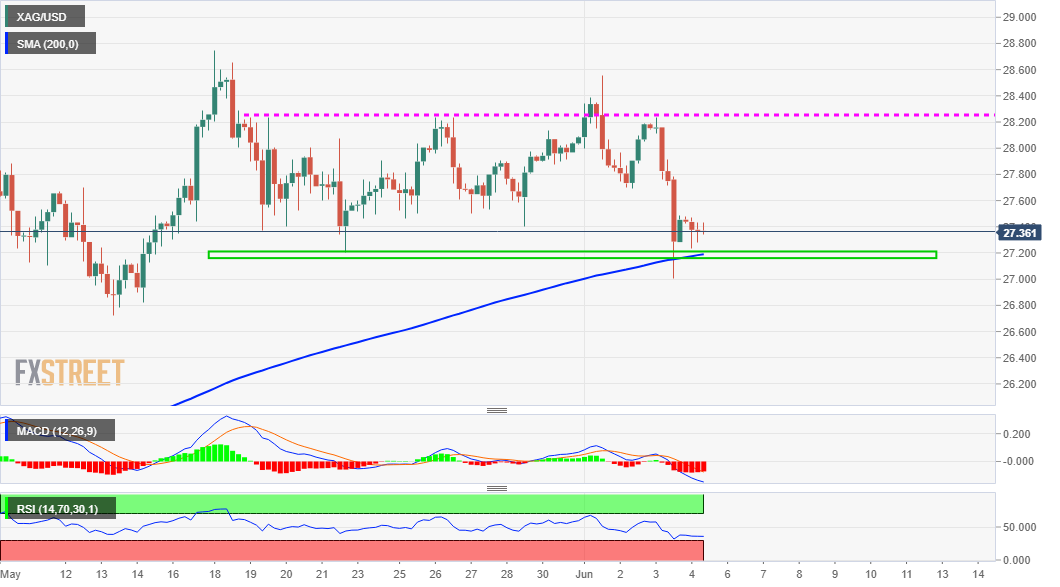
- Sustained weakness below the $27.00 mark would pave the way for a further near-term decline.
Silver struggled to capitalize on the previous day’s bounce from three-week lows and witnessed a subdued/range-bound price action on Friday. The commodity remained confined in a narrow trading band, just below mid-$27.00s through the first half of the European session.
From a technical perspective, the XAG/USD attracted some buying near the $27.00 mark and for now, seems to have stalled this week’s depreciating move. The mentioned handle should now act as a key pivotal point and help determine the next leg of a directional move.
Meanwhile, technical indicators on the daily chart – though have been losing positive traction – are yet to confirm a bearish bias. This makes it prudent to wait for some strong follow-through selling below the mentioned handle before positioning for any further decline.
The XAG/USD might then accelerate the slide to the $26.60 horizontal resistance breakpoint, now turned support en-route the $26.00 round figure. The downward trajectory could further get extended towards the very important 200-day SMA, currently near the $27.75-70 region.
On the flip side, immediate resistance is pegged near the $27.55-60 region, above which bulls are likely to aim back to reclaim the $28.00 mark. This is followed by the $28.25-30 supply zone, which if cleared decisively will be seen as a fresh trigger for bullish traders.
The $28.55 region, ahead of May monthly swing highs, around the $28.75 should act as the next relevant resistance. Some follow-through buying should pave the way for a move beyond the $29.00 mark, towards an intermediate barrier near the $29.60 region and the $30.00 psychological mark.
XAG/USD 4-hour chart
Technical levels to watch
