- Silver trapped between two key barriers hourly chart.
- Hourly RSI has turned flat while steadying at midline.
- Downside appears more compelling in the near-term.
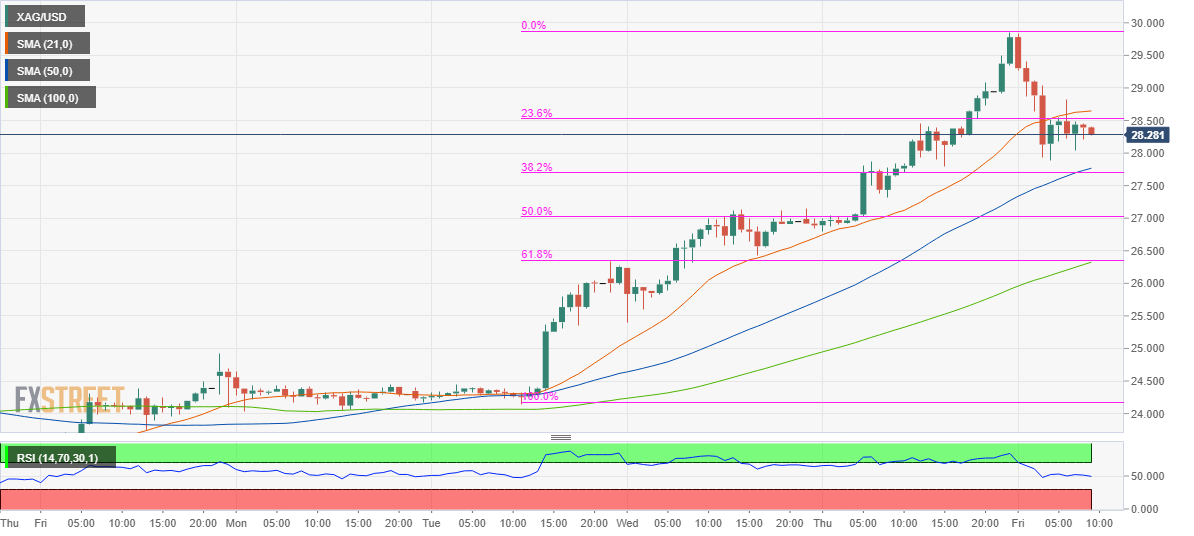
Silver (XAG/USD) extended the ongoing relentless rally and recorded fresh 7.5-year highs at $29.86 in the Asian trades before correcting $2 to $$27.88.
The spot remains in a consolidative mode, with the upside attempts capped near $28.60/80 region, which is the confluence of the 21-hourly Simple Moving Average (HMA) and 23.6% Fibonacci (Fib) Retracement of the fresh rally to multi-year tops seen from August 4.
A sustained break above the 21-HMA could trigger a renewed upside towards the $29.85/30 levels.
Alternatively, to the downside, powerful support awaits at $27.70, the convergence of the 50-HMA and 38.2% Fib of the same advance.
The Fib 50% level at $27.02 will offer the next cushion should the selling pressure intensify.
The hourly Relative Strength Index (RSI) holds steady at the midline, suggesting a lack of clear directional bias. However, with the corrective pullback and overbought conditions on the daily chart, the downside appears more compelling.
Silver: XAG/USD hourly chart
Silver additional levels
