- Silver stays heavy near the lowest since mid-December 2020.
- A clear downside break of the key SMA, bearish MACD favor sellers.
- $23.60 can offer immediate support ahead of 38.2% Fibonacci retracement and six-month-old rising trend line.
Silver’s heaviest declines in over a week landed it below 200-day SMA on daily closing for the first time since May on Tuesday.
Even if the white metal sellers catch a breather around $24.00, bearish MACD and a sustained break of important SMA suggests the quote’s further weakness.
As a result, the commodity prices stay directed towards a horizontal area comprising multiple lows marked during early December 2020, near $23.60.
However, the quote’s further weakness will be tested by 38.2% Fibonacci retracement of March 2020 to February 2021 upside and an ascending support line from September 24, 2020, respectively around $23.00 and $22.45.
Meanwhile, a daily closing beyond the 200-day SMA level of $24.85 should recall the $25.00 threshold and $25.50 resistance back to the chart.
Though, silver’s run-up beyond $25.50 will be questioned by a downward sloping resistance line from February 01, 2021, close to $25.70 by the press time.
Silver daily chart
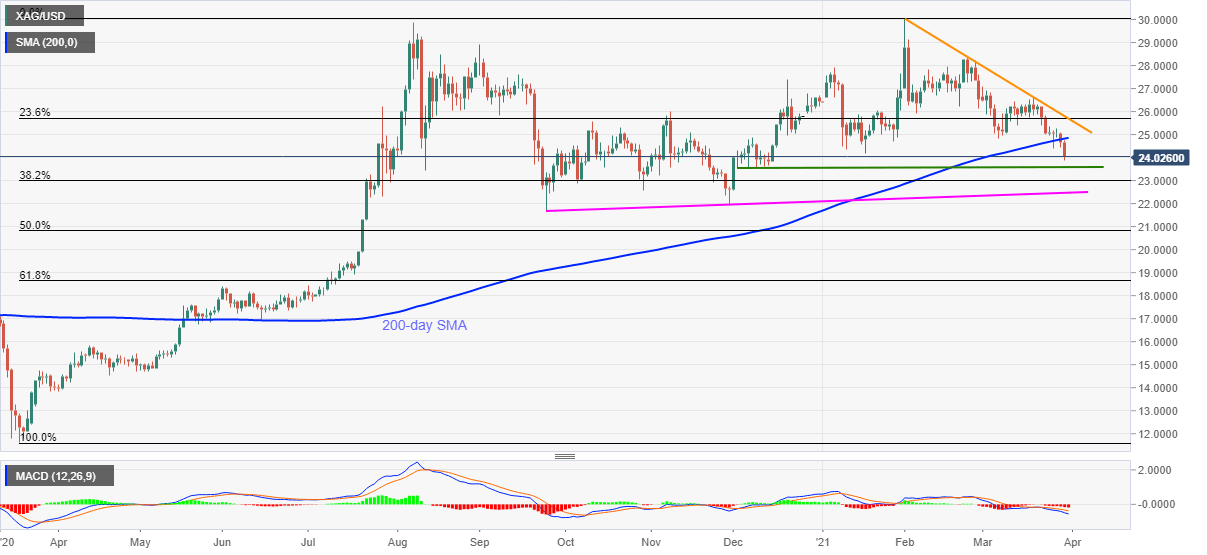
Trend: Bearish
