Silver (XAG/USD) is on the rise for the third straight on Monday, hitting fresh five-day highs near $27.80, as the bulls look to conquer the $28 mark. Silver is piggybacking on gold’s surge, as the yellow metal extends its break above $1850, fresh three-month highs. Dovish Fed expectations-led decline in the US Treasury yields favors the non-yielding precious metals.
How is Silver positioned on the technical graphs?
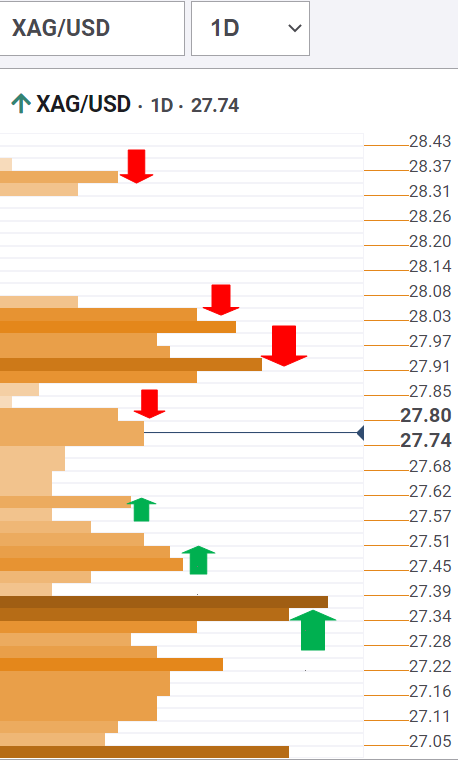
Silver Price Chart: Key resistance and support levels
The Technical Confluences Detector shows that Silver is probing minor resistance at $27.80, which is the convergence of the Bollinger Band one-day Upper and previous high one-hour.
The next fierce resistance awaits at $27.91, the confluence of the previous high and pivot point one-day R2.
Further north, the pivot point one-month R2 at $28.05 could emerge as a strong barrier.
A sustained move above the latter could trigger a rally towards $28.35, where the pivot point one-day R3 lies.
Alternatively, immediate support is seen at $27.60, the intersection of the previous low four-hour and SMA10 one-hour.
The XAG bears will face a strong hurdle around $27.45, which is a dense cluster of support levels, comprising of the Fibonacci 61.8% one-week, previous day high and Bollinger one-hour Middle.
The confluence of the Fibonacci 23.6% one-day, SMA100 one-hour and SMA5 one-day at $27.30 is the level to beat for the sellers.
Here is how it looks on the tool
About Technical Confluences Detector
The TCD (Technical Confluences Detector) is a tool to locate and point out those price levels where there is a congestion of indicators, moving averages, Fibonacci levels, Pivot Points, etc. Knowing where these congestion points are located is very useful for the trader, and can be used as a basis for different strategies.
