Silver is looking for a new direction and fundamentals are pointing to a large bullion squeeze that could lead to large gains. The industrial metal that is used for green technologies is somewhat detached from the price of gold.
How is XAG/USD positioned on the charts?
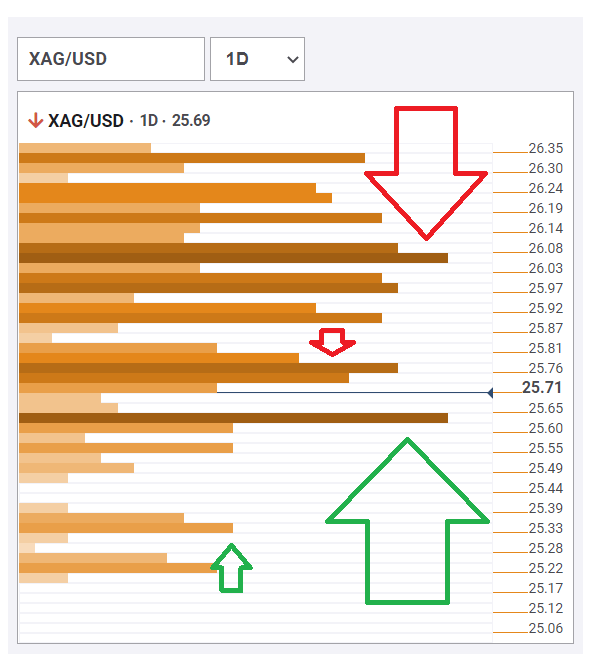
The Technical Confluences Detector is showing that contrary to fundamentals, the charts are pointing to a somewhat more precarious situation. Silver has critical support at $25.60, which is the convergence of the Fibonacci 161.8% one-day, the Simple Moving Average 10-1h, and the 100-day SMA.
However, the precious metal’s next cushions are considerably weaker. One noteworthy level to watch is $25.33, which is where the Pivot Point one-week Support 2 and the Bollinger Band one-hour Lower meet up.
Resistance comes fast and thick for XAG/USD. The initial hurdle is %25.76, which is the confluence of the previous week’s low and the BB 1h-Middle among others.
It is followed by a series of clusters culminating at $26.03, which includes the SMA 100-1h, the SMA 200-1h, the SMA 50-4h, the Fibonacci 61.8% one-day and others.
XAG/USD resistance and support levels
Confluence Detector
The Confluence Detector finds exciting opportunities using Technical Confluences. The TC is a tool to locate and point out those price levels where there is a congestion of indicators, moving averages, Fibonacci levels, Pivot Points, etc. Knowing where these congestion points are located is very useful for the trader, and can be used as a basis for different strategies.
Learn more about Technical Confluence
