- Silver takes out the falling trendline resistance.
- Bullish crossover and RSI above 50.00 points to more gains.
- XAG/USD looks to $28 and beyond.
Silver (XAG/USD) is trying hard to find a foothold above the $27 mark after clearing a major resistance at $26.98.
That level is the confluence of the bearish 100-hourly moving average (HMA) and falling trendline resistance.
The hourly Relative Strength Index (RSI) has pulled back from the overbought region while it holds well above the midline, suggesting that the bullish bias remains intact.
Adding credence to the upside, the price spots a bull crossover, as the 21-HMA cut the 200-HMA from below.
Silver Price Chart: Hourly
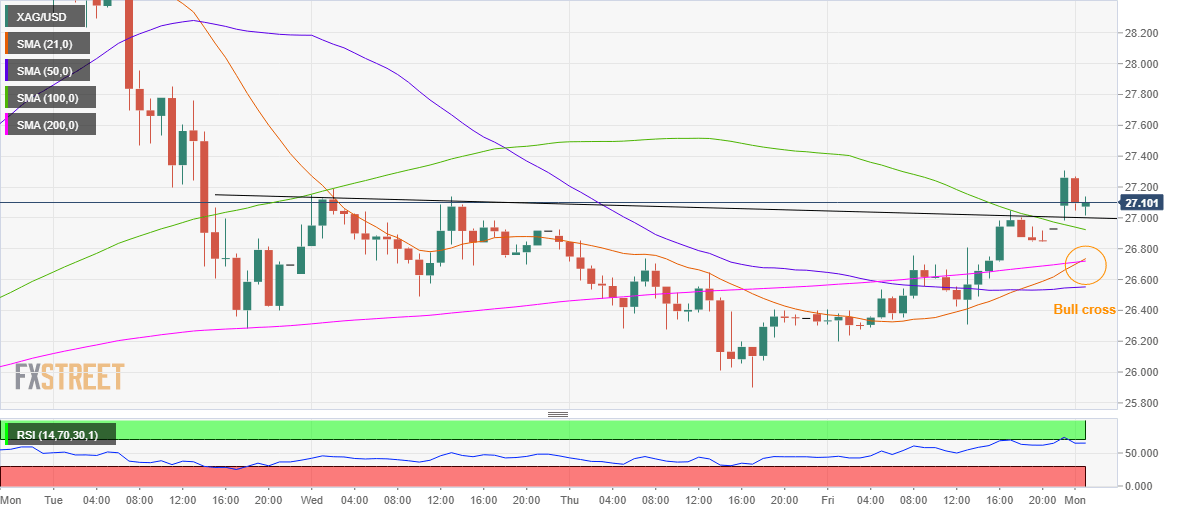
The next target for the XAG bulls is seen at the $28 mark once they find acceptance above February 3 highs of $27.19.
To the downside, the bulls defend the critical resistance now support around $27, below which the convergence of the 21 and 200-HMA at $26.73 could be tested.
Further south, the 50-HMA at $26.55 could be the last line of defense for the buyers.
Silver Additional levels
