- Silver prices stay sluggish after stepping back from $27.62.
- The bearish chart pattern joins downbeat MACD signals to keep sellers hopeful.
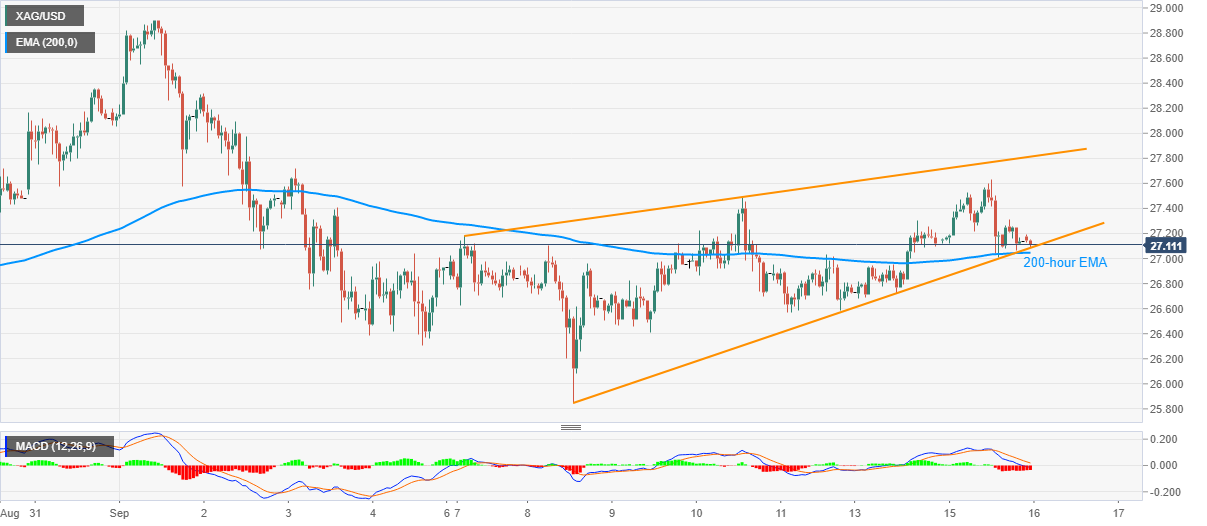
- 200-hour EMA adds to the downside support around $27.00.
Silver treads water around $27.10 ahead of Wednesday’s Tokyo open. In doing so, the white metal sellers attack the support line of the one-week-old bearish formation, rising wedge, amid red signals by the MACD.
Other than the lower line of the downbeat chart play, 200-hour EMA also signifies the $27.00 threshold as the key support.
Hence, a downside break of $27.00 will quickly challenge the monthly low of $25.84. However, silver traders may catch a breather around $26.60 and $26.40 during the fall.
Meanwhile, $27.30 and the recent high, also the weekly top, near $27.60 can entertain short-term buyers ahead of directing them to an ascending trend line from September 07, forming part of the bearish chart pattern, currently around $27.80.
Also acting as the upside barrier to the commodity’s run-up towards the monthly high of $28.90 are the $28.00 round-figures and $28.30.
Silver hourly chart
Trend: Bearish
