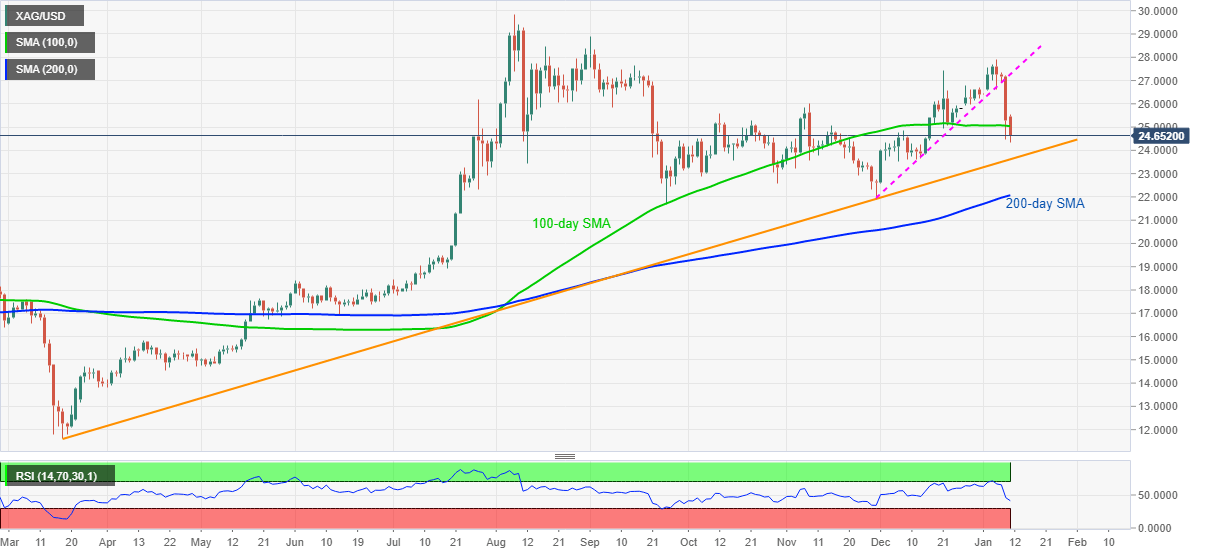
- Silver bears catch a breather after refreshing multi-day low.
- Downside break of 100-day SMA directs sellers toward an ascending trend line from March 18.
- Bulls look for entries beyond previous support line.
Having dropped to a fresh low since the mid-December, silver takes rounds to $24.60, down 2.70%, during early Monday. While a downside break of an ascending trend line from November 30 pleased the commodity sellers during last week, the latest south-run below 100-day SMA highlights a multi-month-old support line for sellers.
It should be noted that an absence of oversold RSI adds strength to the downside momentum.
That said, the $24.00 round-figure can offer an intermediate halt during the fall targeting an aforementioned support line, currently near $23.60.
Also acting as the key support is 200-day SMA, at $22.07 now, followed by November’s low of $21.89.
On the contrary, an upside break of 100-day SMA, currently around $25.03 can aim for November’s top near $26.00. However, any further rise needs to regain above the previous support line, at $27.25, to convince buyers. Additionally, the monthly high of $27.92 acts as an extra filter to the north.
Overall, silver prices have some more room to the downside before confronting the key technical supports.
Silver daily chart
Trend: Further weakness expected

