- Silver gained some positive traction for the second consecutive session on Friday.
- Bearish oscillators on 4-hour/daily charts support prospects for further weakness.
- Any meaningful move up could get sold into and remain capped near the $25.00.
Silver edged higher for the second straight session on Thursday and might now be looking to build on the overnight goodish rebound from the lowest level since mid-December 2020. The white metal was last seen trading around mid-$24.00, up 0.25% for the day.
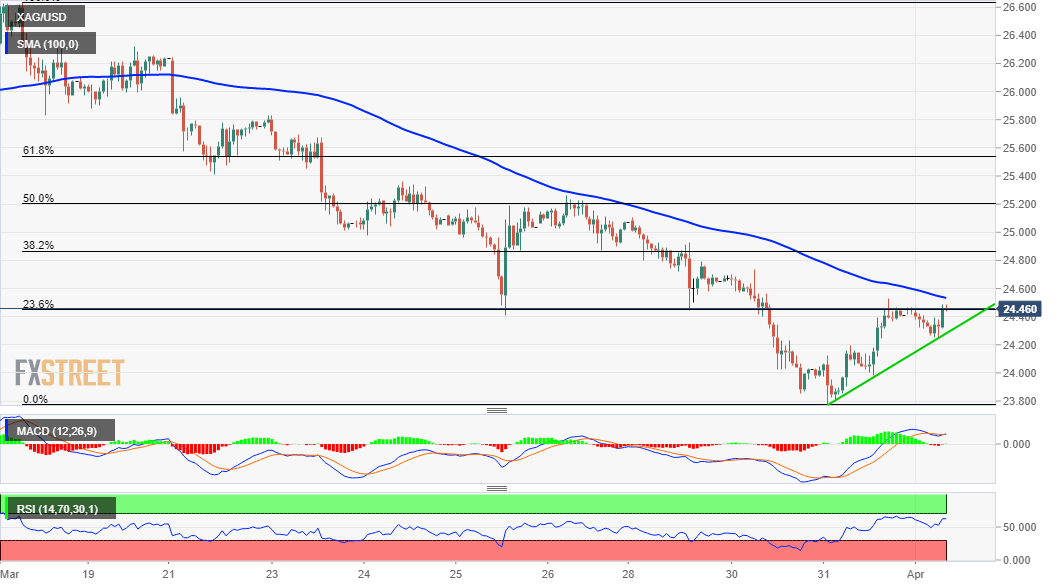
The mentioned region marks the 23.6% Fibonacci level of the $26.64-$23.78 recent decline and is closely followed by 100-hour SMA. A sustained move beyond will be seen as a fresh trigger for intraday bullish traders and trigger some short-covering around the XAG/USD.
Meanwhile, technical indicators on the 1-hour chart have been gaining positive traction and support prospects for further gains. That said, bearish oscillators on 4-hour/daily charts warrant some caution before positioning for any meaningful recovery for the XAG/USD.
Hence, any subsequent strength will still be seen as a selling opportunity near the $24.70 supply zone. This, in turn, should cap the XAG/USD ahead of the key $25.00 psychological mark, representing the 38.2% Fibo. level, which should act as a strong barrier.
On the flip side, an intraday ascending trend-line support, around the $24.35-30 region could protect the immediate downside. A convincing break below has the potential to drag the XAG/USD towards the $24.00 mark en-route multi-month lows, around the $23.80-75 region.
Some follow-through selling will mark a fresh bearish breakdown and set the stage for a slide towards testing December 2020 monthly swing lows, around the $22.60-55 region. Intermediate supports on the way down area pegged near the $23.25 region and the $23.00 mark.
Silver 1-hour chart
Technical levels to watch
