- XAG/USD is currently not following gold as the metal is close to 2020 lows
- More consolidation is likely in the short term.
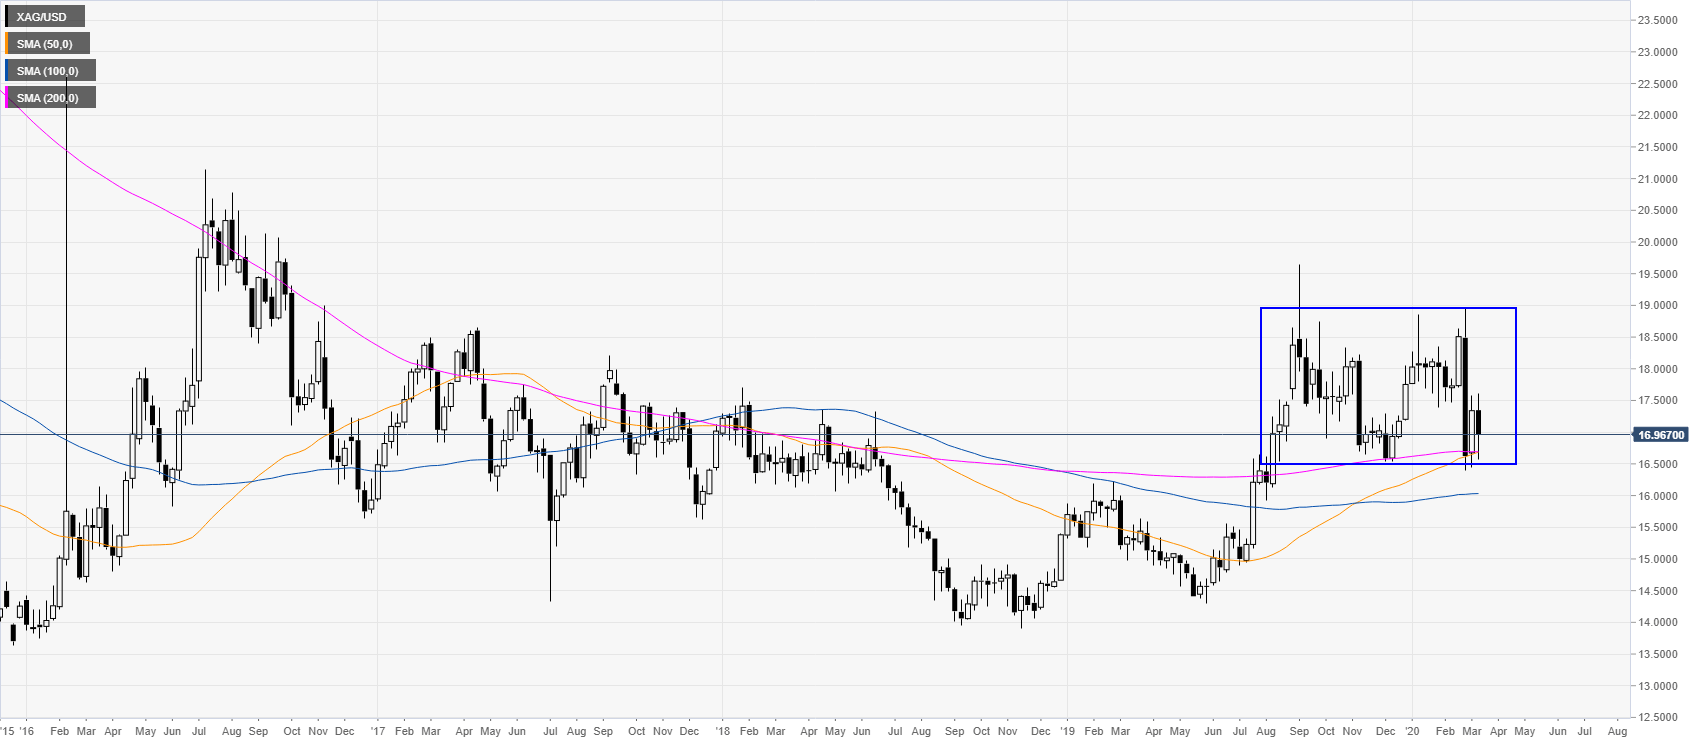
Silver weekly chart
In the first two months of 2020, Silver is keeping consolidating the advance made in 2019. The market is trading near the bottom of a rectangle formation just above the main weekly simple moving averages (SMAs). Silver is not reacting as much as gold to coronavirus fears.
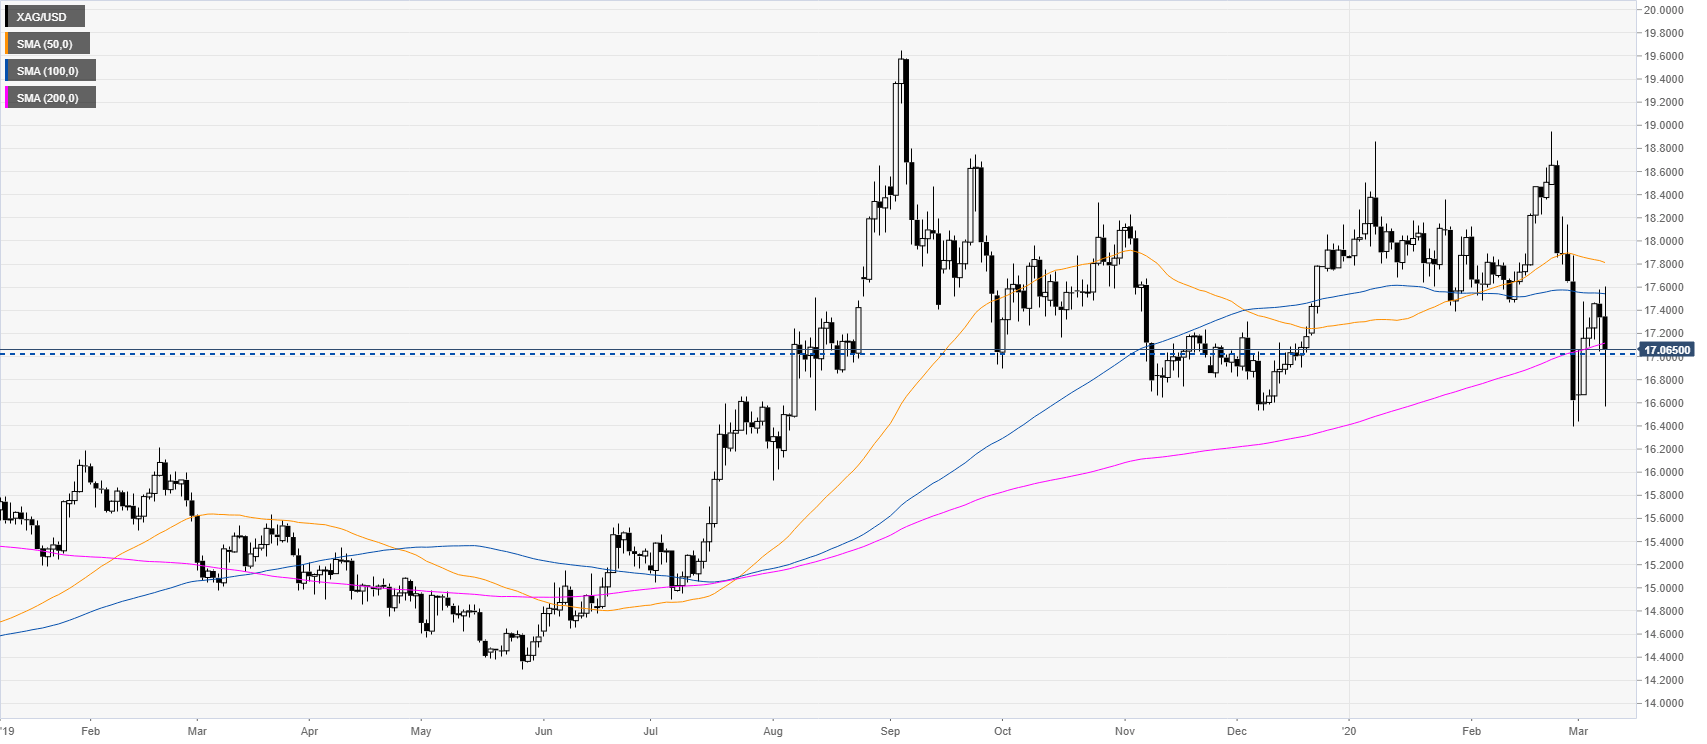
Silver daily chart
The market is battling with the 17.00 figure and the 200 SMA on the daily chart. A daily close below the above-mentioned levels might be seen as bearish in the medium term.
Silver four-hour chart
Silver is trading below the main SMAs as bears want to break below the 2020 low near the 16.40 level. A break below it could lead to further losses towards the 16.10 and 15.90 price levels. On the flip side, resistance is seen near the 17.52 level and a sustained break above it could trigger buying interest towards the 17.80 and 18.25 levels.
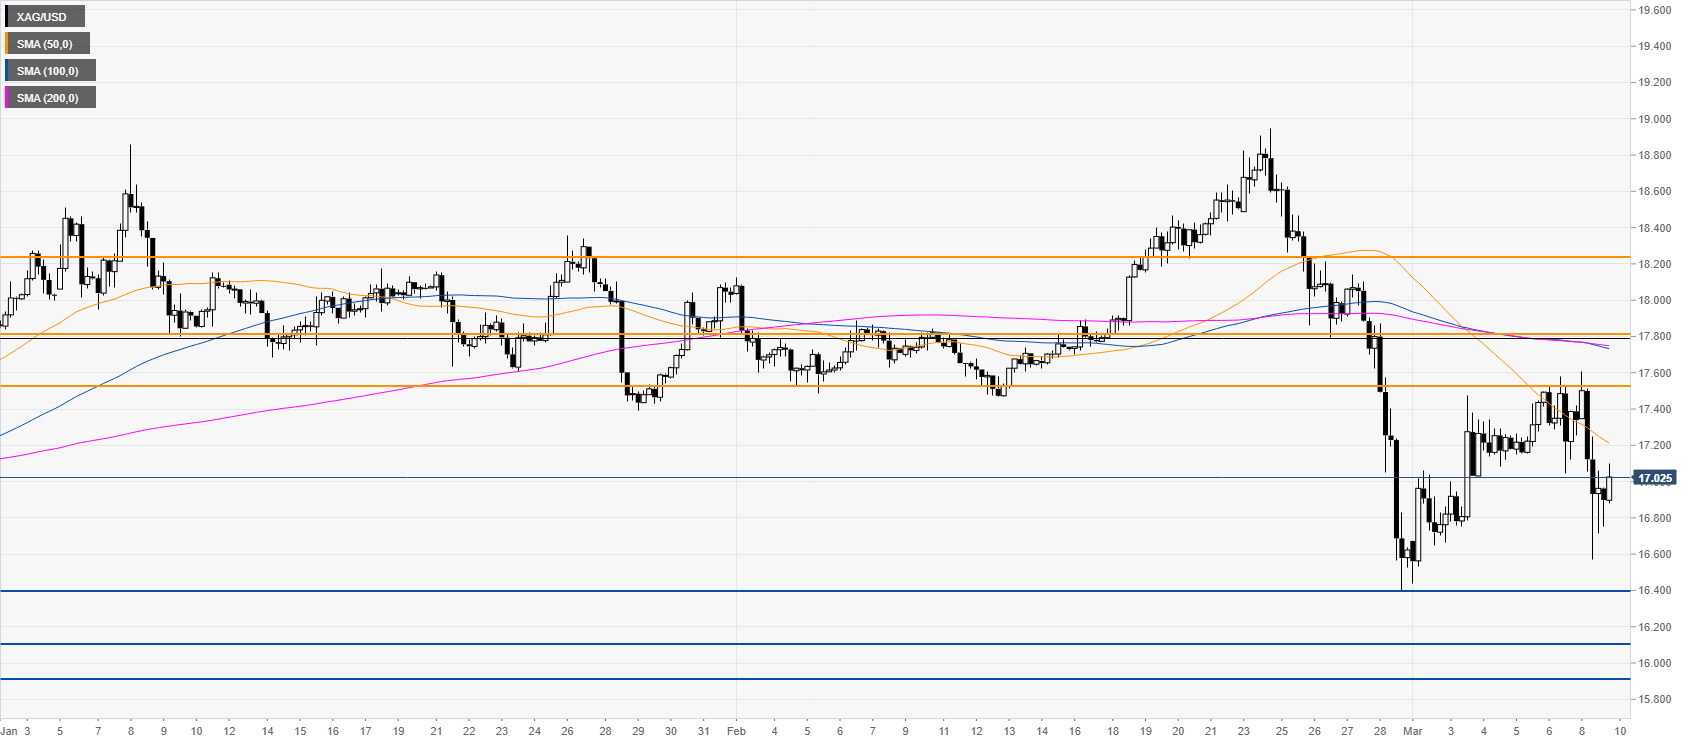
Resistance: 17.52, 17.80, 18.25
Support: 16.40, 16.10, 15.90
Additional key levels
