- Silver bears take a breather before the next push lower.
- Rising wedge breakdown on 1H, lack of healthy supports point south.
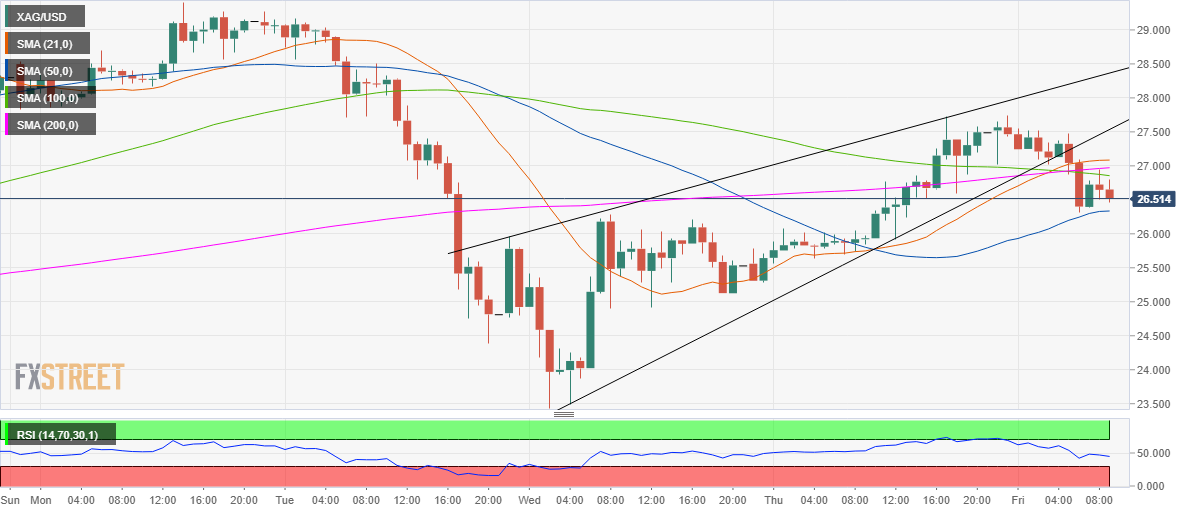
- Hourly RSI inches slightly lower below the midline, bearish.
Silver (XAU/USD) is consolidating the downside break spotted on the hourly sticks after the price dived out of the rising wedge formation earlier this Friday.
The rising wedge is a bearish continuation pattern, suggesting the spot is poised for additional losses. The hourly Relative Strength Index (RSI) also backs the case for the further downside, as it has turned slightly lower below the midline (50.0).
The bears need a decisive break below the horizontal 50-hourly Simple Moving Average (HMA) support at $26.34 to trigger a fresh sell-off towards the $26 mark.
The next downside target is marked at Thursday’s low of $25.28, which will be critical to defending the near-term bullish bias.
On the flip side, the bulls need acceptance above a cluster of robust resistance levels stacked up around $26.90-27 levels for a move higher. That area is the confluence of the 21, 100 and 200-HMAs.
Although, the rising trendline (pattern) support-turned-resistance at $27.53 will be the level to beat for the XAG bulls.
XAG/USD: Hourly chart
XAG/USD: Additional levels
