- Silver is teasing a symmetrical triangle breakout on hourly chart.
- Upside appears more compelling amid a lack of healthy resistance levels.
- Hourly RSI trades above 50.00, supporting the bullish case.
Silver (XAG/USD) is on the verge of a range breakout after it consolidated above $24, within a symmetrical triangle formation on the one-hour chart this Tuesday.
A break above the falling trendline resistance at $24.37 will validate the pattern, opening doors for a test of the upside target at $25.57.
Ahead of that level, the spot could test the psychological resistance of $24.50. The next hurdle awaits at $24.95, the intersection of July 29 and August 3 high.
The hourly Relative Strength Index (RSI) holds steady above the midline, backing the case for the upside.
While to the downside, the $24.28 level offers strong support, which the convergence of the rising trendline support, 21 and 50-HMAs.
Selling pressure will intensify on a break below the latter, calling for a test of the horizontal 100-HMA at $24.06.
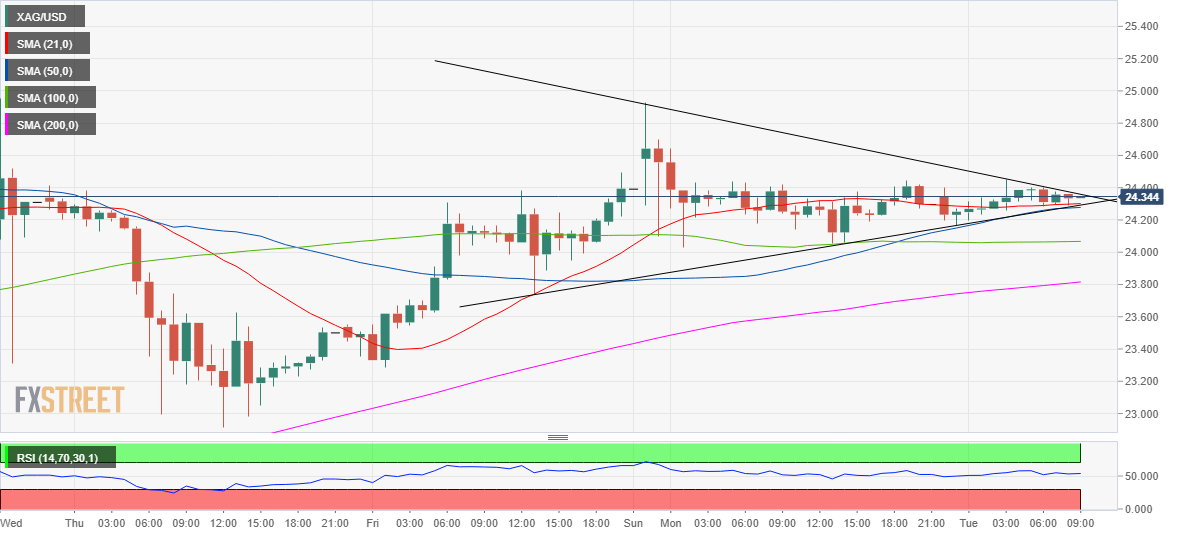
The next cushion is placed near $23.80, where the 200-HMA and the triangle lowest point.
Silver: XAG/USD hourly chart
Silver additional levels
