- Solana price is under immense selling pressure after setting a new all-time high at $221 on September 09.
- SOL has dropped outside the ascending parallel channel as a plunge towards $142 looms.
- A decisive bullish correction will be realised if Solana rises to trade with the ascending parallel channel.
Solana price retracement continues after setting a new record-high at $215 on September 07 when the rest of the crypto market was bleeding following the flash crash. Although SOL’s retracement started on Thursday September 09, the ‘Ethereum killer’ defied the ensuing bearish pressure to record a new all-time high around $221 on Thursday. The altcoin’s bearish momentum continues to build up after losing 13% over the last 24 hours to seek support at the $150 psychological level.
Solana Price May Drop Towards The $142 Support Zone
Solana price has dropped from 30% from its all-time high around $221 to the current price at $157.0. Solan price could bleed further if the bearish momentum ensues. On the daily chart, Solana has dropped outside the ascending parallel channel as the asset continues to lower highs and lower lows.
While the SOL price continues to drop, Solana is likely to discover the crucial support at the tip of the lower boundary of the ascending parallel channel at the $150 psychological level. Note that if Solana closes the day below this crucial level, the altcoin might fall further towards the $142 support zone, an 11% drop from the current price.
SOL/USD Daily Chart
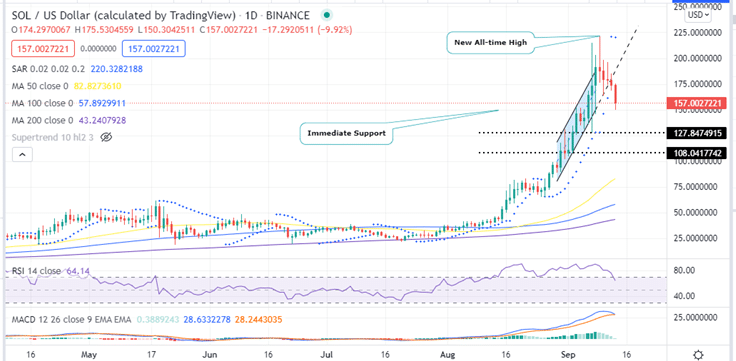
Should selling pressure build up and Solana loses the $142 support, Solana price will drop further to tag the $137 and the $127.84 support zones respectively.
The Relatively Strength Index (RSI) indicator shows that Solana was massively overbought recently and that the current price correction shows that the bullish momentum had burnt out. Moreover, the downward movement of the RSI away from the overbought region shows that the sellers are currently in the driving seat adding credence to SOL’s bearish narrative.
Also note that the Moving Average Convergence Divergence Indicator (MACD) is about to send a sell signal. This will happen when the 12-day Exponential Moving Average (EMA) crosses below the 26-day EMA indicating that Solana’s market momentum has turned bearish. Also note the SuperTred indicator has just sent a call to sell crypto signal on the four-hour chart. This happened when the SuperTrend line crossed flipped above the price earlier today. Note that as long as the SuperTrend remains above the SOL price, the bearish momentum will continue.
SOL/USD Four-Hour Chart
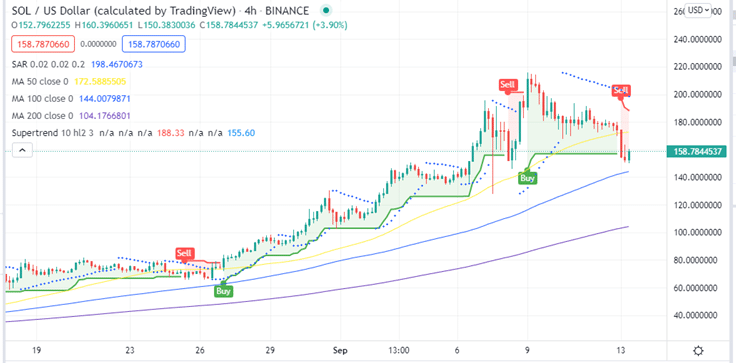
On the flip-side, if SOL holds on to the support at the $150 level and closes the day above this level, the Solana price will tag the $174 resistance level. A rise beyond this level will the SOL price be able to bounce back within the ascending parallel channel. The likely bullish target for SOL is at $180, where it coincides with the lower boundary of the chart pattern.
Where To Buy SOL?
If you wish to buy cryptocurrencies including Solana, crypto exchanges such as eToro , Binance, Coinbase, Bittrex and Kraken are good places to visit.
Looking to buy or trade Solana now? Invest at eToro!
Capital at risk
