- Solana price meets resistance at the 100-SMA to delay a bullish breakout through the descending parallel channel.
- The SuperTrend indicator continues to hold above the price to confirm this bearish outlook.
Solana Price continued the downtrend following resistance around $38.21. The descending parallel channel’s upper boundary reinforced the level, leading to losses towards $31. A continued price action below the upper boundary resistance will confirm a downswing beyond $31. Moreover, SOL has been closing below the 100-day Simple Moving Average (SMA) on the four-hour chart. If this continues, the continuation of the bearish outlook appears inevitable.
Solana Meets Lower Resistance to Sustain Downtrend
Immediate resistance has been provided by the 100-day SMA. At the time of writing, Solana was exchanging hands at around $31.40. The Relative Strength Index (RSI) shows that SOL continues suffering at the steady hands of the bears. If the resistance at the 100-day SMA remains intact, Solana price will continue reversing the recovery that was started on June 22 towards losses below $31.36. If this happens, it will confirm the continuation of this bearish outlook and trigger crypto signals to sell SOL amidst speculation for losses towards record lows.
Solana Price (SOL/USD) Four-Hour Chart
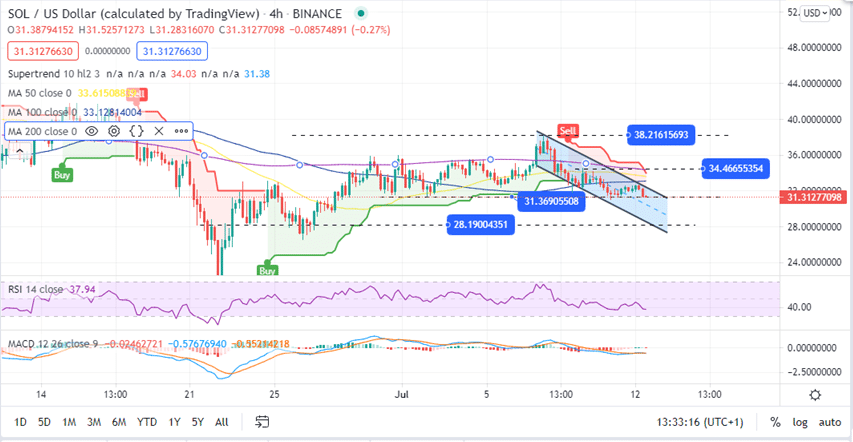
The four-hour chart also highlights the pressure the sellers have put in, especially with a bearish signal from the SuperTrend indicator. The SuperTrend is a chart overlay indicator that follows a trend of a particular cryptocurrency. It utilizes a true average to determine the volatility of the market. For example, the SuperTrend indicator sent a sell signal to buy SOL on June 8.
This was confirmed by the Moving Average Convergence Divergence (MACD) indicator when the MACD line (blue), crossed below the signal line on the same date. Since then, the Solana price has been on the decline. As long as the SuperTrend line holds above the price, Solana Price could see significant declines.
Is there an upside to this?
A look at the other side reveals that Solana price could anchor on major support at around $28, a region highlighted by the lower boundary of the descending parallel channel. If bulls can pivot on this point, they can push the SOL price beyond $33, a region defined by the 100-day SMA to overturn the downtrend.
If this happens, SOL buyers might retest the resistance at $34 or even beyond that towards the two-week high at $38.
Moreover, the Doji candlestick at the end of the four-hour chart indicates indecision in the market and that the market might be heading towards consolidation in the near term.
As such, investors might have to wait before entering the market.
In the meantime, look at the next cryptocurrencies to explode for guidance on which assets to invest in.
Looking to buy or trade Solana now? Invest at eToro!
