- Solana price recovers quickly from a slump to $22.
- A double-bottom technical pattern bolsters SOL into an upswing targeting $36.
- Parabolic SAR flipped from negative to positive affirming the bullish narrative.
Solana is exchanging hands 21% higher than the recently tested support at around $22. Recovery was quick and sharp, probably due to bulls’ congestion near the support area. It could also be that investors took advantage of the Tuesday downswing that was experienced across the market and entered the market while prices were lower and speculate gains towards $36.
At press time, SOL was trading at $26 while battling an immediate resistance posed by the 20-day Simple Moving Average at $27. Note that a 12-hour candlestick closure above this level will see Solana price breakout upwards as buyers eye $36, 37% above the current price.
Solana Price Nurtures a Double-Bottom Recovery Pattern
SOL appears to have formed a double-bottom pattern on the 12-hour chart after the sell-off was halted at $22. A double-bottom is an exceptionally bullish chart pattern that often results in a trend reversal.
Note that this pattern forms when an asset tests a support level twice without breaking below it. The two bottoms are usually separated by a moderate peak as shown on the SOL 12-hour chart.
A breakout from this technical pattern will be confirmed when the Solana price jumps over the resistance level equal to the peak at $36. If this happens, SOL could explore highs recorded at the beginning of June at around $44.
Solana Price (SOL/USD) 12-Hour Chart
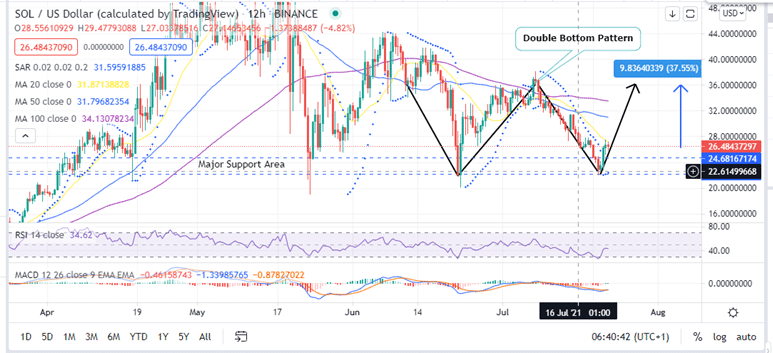
Apart from the technical chart pattern, the parabolic SAR flipped from negative to positive on July 22 adding credence to the bullish outlook. This bullish narrative is further reinforced by the Moving Average Convergence Divergence (MACD) on the 12-hour chart. Note that traders responded to the bullish crypto signal when the MACD line (blue) crossed over the signal line. The uptrend will gain more momentum once the MACD crosses the neutral line into the positive region.
The strength of the bullish momentum has been highlighted by the Relative Strength Index’s (RSI) steep climb from the oversold areas. A cross over the midline will trigger more buy orders to bolster the bullish momentum even higher.
Note that a daily closure above the immediate Solana price barrier at $27 is crucial to sustaining the anticipated upward breakout.
Can the Upward Breakout Be Invalidated?
It is worth noting that the uptrend will be invalidated if the RSI retraces back towards the overbought areas. Closing the day under the 20-day SMA at $27 will also curtail the recovery efforts and trigger another sell-off, resulting in another correction to $20 and $16 respectively.
If you are seeking to buy Solana, this list of crypto brokers might be helpful.
Looking to buy or trade crypto now? Invest at eToro!
Capital at risk
