- Solana price remains bullish as shown by the MACD, RSI and Parabolic SAR indicators.
- SOL needs to close the day above the $40 level to sustain the bullish momentum.
- Solana sits on robust support provided by 50, 100 and 200 SMAs.
Solana price opened the day trading in the green as bulls remain focused to make it two straight bullish days. This bullish momentum saw SOL break above the $40 psychological level for to a high of $40.61during early Asian session. Solana has however given into overhead pressure at the $40 mark to the current price at around $39.96.
SOL needs to break above the $40 resistance level to bring area around $45 into play.
Can Solana Price Violate the $40 Resistance Level?
Solana has had an impressive 75% rally from $22.82 on July 21 to a high of around $39.90 on August 06. This rally saw SOL flip the 50 Simple Moving Average (SMA), 100 SMA and the 200 SMA from resistance to support.
Since then, there have been several attempts to break above the $40 psychological level buy sellers are determined to make sure the price doesn’t rise any higher. Today’s attempt to break above this level seems to be rejected as well.
Despite this, the Solana appears strong to break above the $40 mark. The support downwards appears robust as SOL is currently supported by the 50, 100 and 200 SMAs respectively.
Moreover, the $37.0 support wall appears robust enough to absorb any buying pressure. Solana bounced off this support level on August 09 in another attempt to push SOL past the $40 mark. Therefore, the current correction in the Solana price might be temporary as it is likely to bounce off this area creating a double bottom pattern that is likely to restart the recovery trajectory.
Note that if Solana closes the day above the $40 psychological level, it will bolster investors to stretch the bullish leg towards $45. SOL will, however, have to overcome the major hurdles at $42 and $43.84 first.
SOL/USD Four-Hour Chart
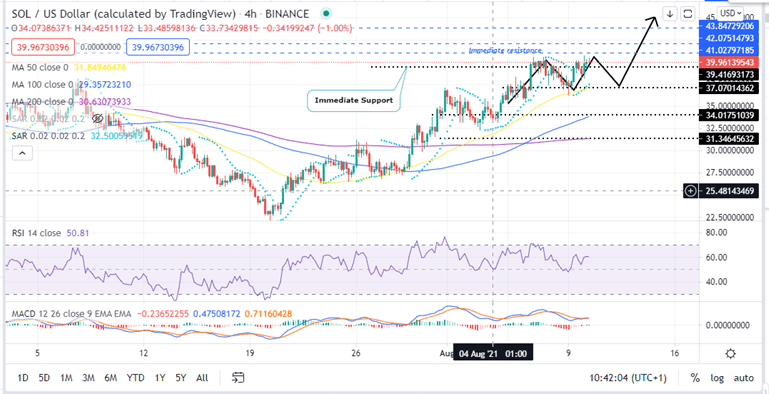
From a technical viewpoint, the Moving Average Convergence Divergence (MACD) indicator just flashed buy crypto signal validating the bullish thesis. This happened when the MACD line (blue) crossed above the signal line (orange). Moreover, the position of the MACD above the zero line in the positive region affirms the bullish bias.
Moreover, the current position of the Relative Strength Index (RSI) at 61.85 shows that the bulls are in control of the Solana price. In addition, the parabolic SAR flipped from negative to positive yesterday adding credence to a bullish SOL.
Looking Over The Fence
On the flip side, if the Solana price closed the day below the $40 psychological level, it will trigger selling orders on crypto trading platforms. If this happens, SOL will be forced to test the major support wall at $37 where the 50 SMA currently sits. A further drop beyond this point could see Solana fall to the 100 SMA at $34 and 200 SMA at $31.34.
Looking to buy or trade Solana now? Invest at eToro!
Capital at risk
