- Solana price has had three straight bullish sessions setting new record highs in every session.
- SOL breaks above $75 to set a fresh all-time-high at $79
- TD sequential indicator sends a bearish signal indicating SOL could correct soon.
Solana price has jumped over 78% in price over the last 7 days according to data from Coinmarketcap. This rally has caused SOL to rise above the $70 mark to record a new all-time high (ATH) around $79 earlier today. Solana is currently ranked #10 on Coinmarketcap with a market capitalisation of $19,661,819,147 which has also jumped by 55% over the same period.
Solana Price Captures Fresh All-Time Highs
Solana booked a spot among the top 10 cryptocurrencies my market capitalisation on Monday. The asset reached a new ATH on that day when it breached the $70 barrier. On Tuesday, SOL continued with bullish momentum with bulls determined to reach higher highs. This saw the Solana price breach the $75 hurdle to set a new ALT high around $77.
Today, Solana is trading in the green for the fourth day running in a rally that has seen it gain over 7% in the last 24 hours to set a fresh ATH around $79.
Against the Dollar, SOL has jumped over 120% over the last two weeks and 160% in the last one month.
Moreover, Solana’s daily trading volume has risen by approximately 300% from $507,980,107 on August 11 to $4,043,742,154.
SOL’s Bullish Momentum Still Holds
At the time of writing, Solana teeters around $76.13 on most crypto exchanges. The Solana price prediction remains bullish in the near future. Technical indicators show that bulls are still in control of SOL.
Yesterday’s and today’s slide under $60 allowed investors to get on board as FOMO grips the SOL market.
Note that a break above $80 will put SOL on track to explore areas around $100. However, for this to happen, Solana must reinforce the support embraced by the May record high at $61.
SOL/USD Daily Chart
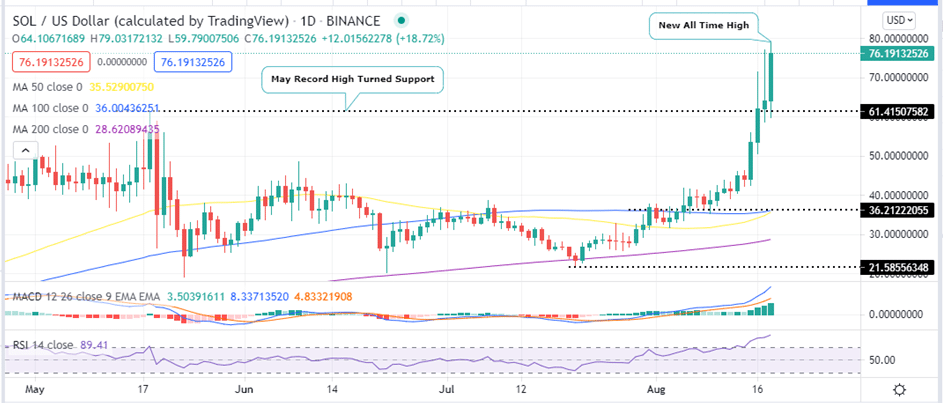
Crypto signals from the Moving Average Convergence Divergence (MACD) indicator adds credence to this bullish thesis. This technical indicator has persistently remained in the positive region with the 12-day EMA moving upwards above the 26-day EMA, hence reinforcing Solana’s uptrend towards $100.
Moreover, the Relative Strength Index (RSI) continues to snub the overbought conditions and is pointed north. This implies that the bullish grip on Solana is tightening while speculation for another rally intensifies.
Can Solana’s Bullish Outlook be Invalidated?
Solana’s bullish thesis may be invalidated if SOL closes the day below then $70 psychological level. If this happens, the Solana price could fall towards the May 18 high around 61. If support at this point fails to hold, Solana could drop below the $60 mark to rest-test the $50 psychological level.
SOL/USD 12-Hour Chart
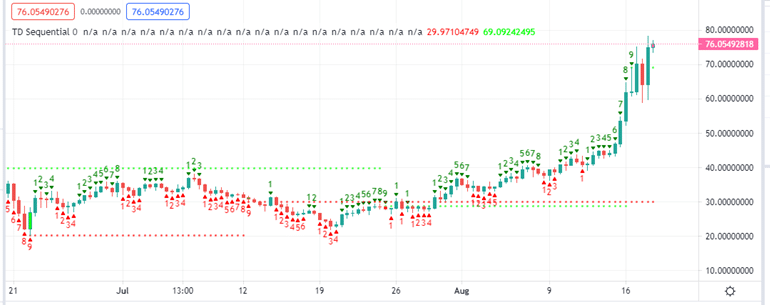
The TD Sequential indicator validates this bearish thesis. It has opened a sell-signal as seen on the 12-hour chart. This happened when the green nine candlestick appeared anticipating a one to four 12-hour candlesticks correction.
Looking to buy or trade Solana now? Invest at eToro!
Capital at risk
