- S&P 500 index is trading off one-month highs, just above the 2800 level.
- The bullish recovery remains intact as buyers need to overcome the 2800/2850 resistance zone.
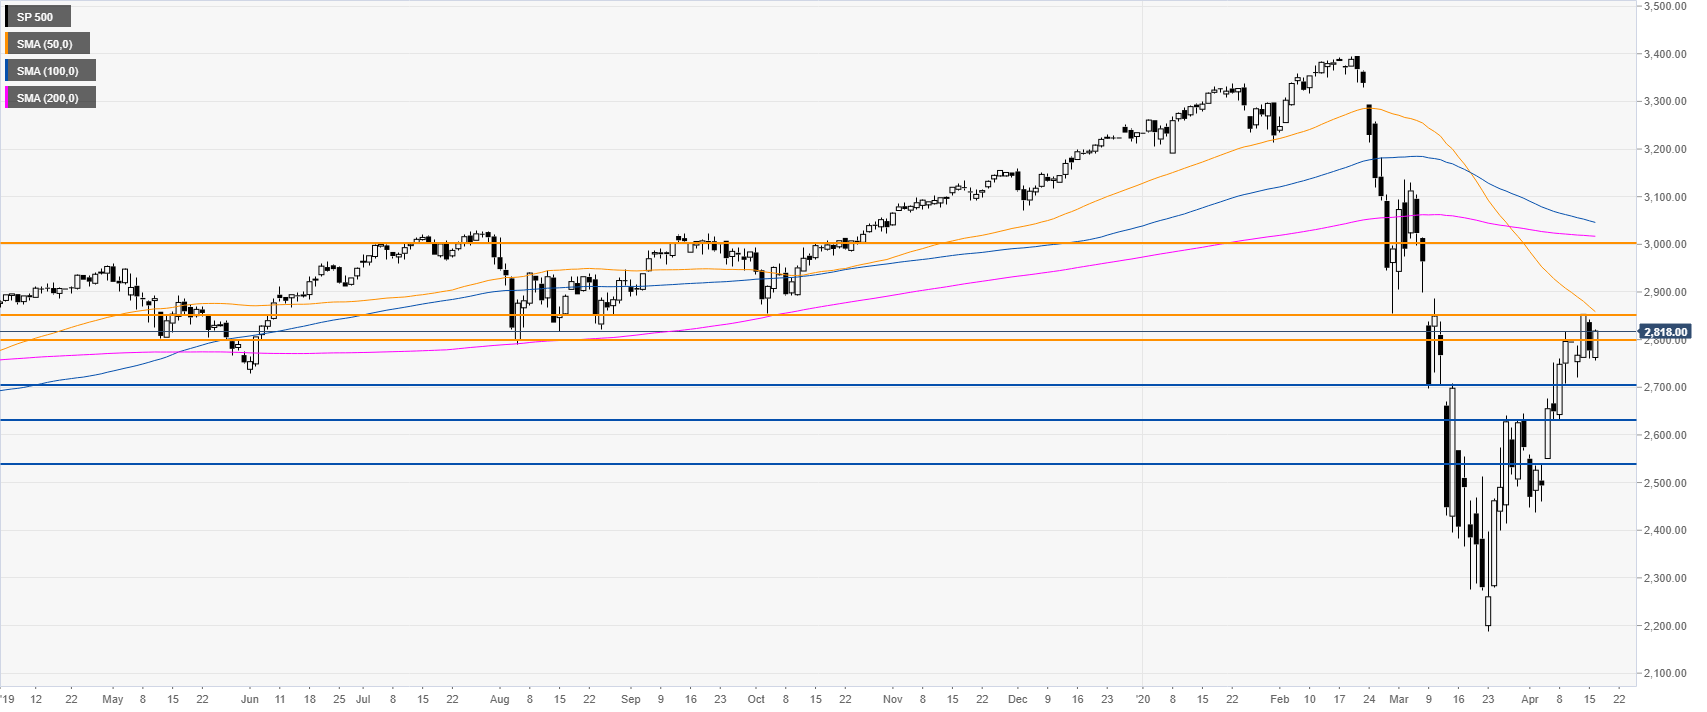
S&P 500 daily chart
The S&P 500 is consolidating after the huge recovery while trading just above the 2800 level. The index is printing higher highs and higher lows however still below its main SMAs on the daily chart. A daily close above the 2800/2850 resistance zone could introduce scope to the 3000 price levels. On the flip side, support can be seen near the 2700 and 2630 levels.
Additional key levels
