- S&P 500 is falling for the second straight day on Wednesday.
- RSI indicator on the daily chart drops below 70.
The S&P 500 Index (SPX) opened in the negative territory on Wednesday after losing 0.78% on Tuesday and seems to be having a tough time staging a rebound. As of writing, the SPX was down 0.47% on a daily basis at 3,192 points. However, the lack of fundamental drivers suggests that the index is in a technical correction phase following the three-week winning streak.
S&P 500 technical outlooks
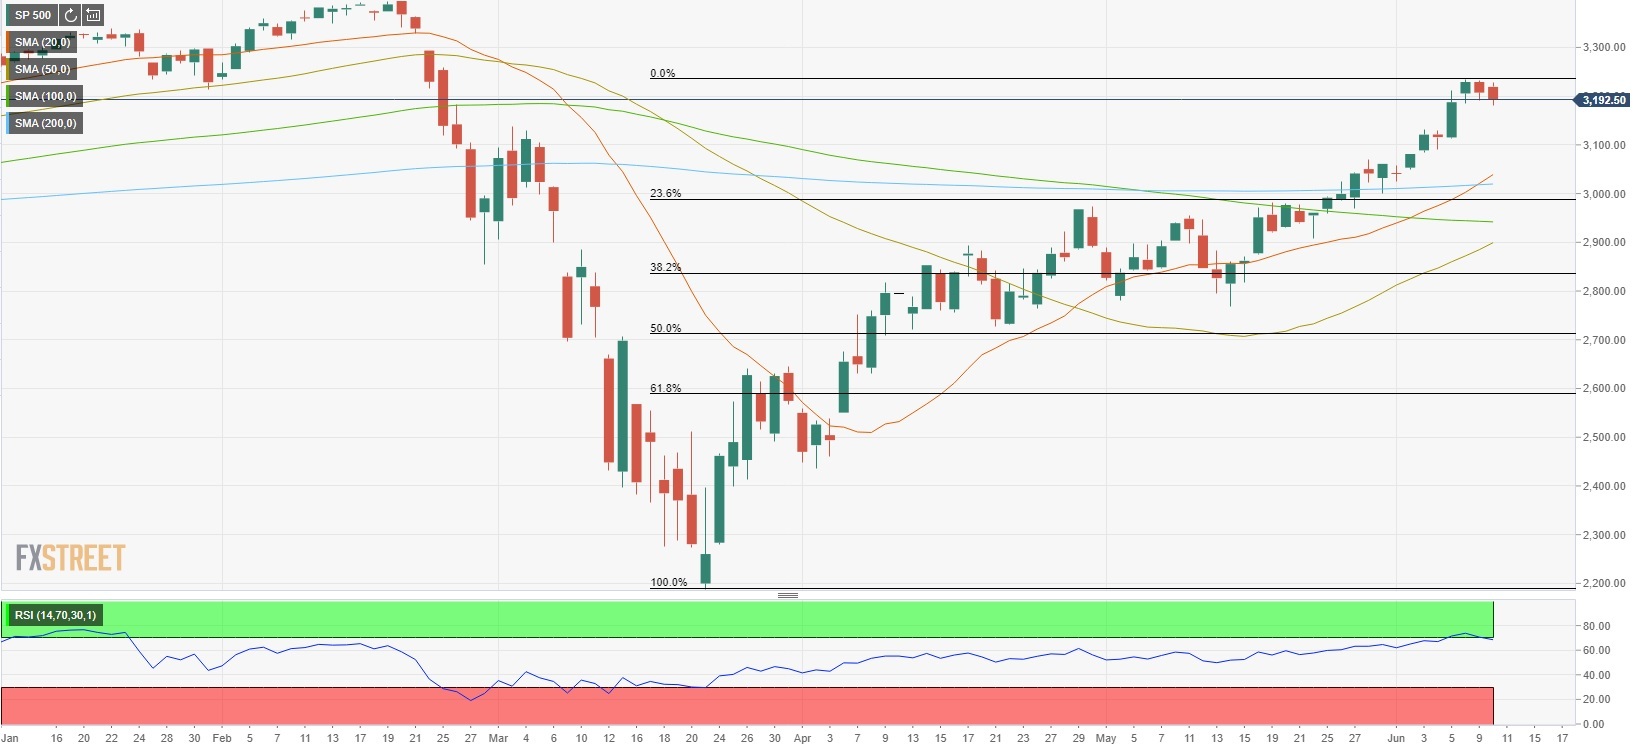
On the daily chart, the Relative Strength Index (RSI) indicator fell below 70, confirming that the view that the bearish pressure is technical. On the downside, the initial support aligns at 3,180 (Feb. 26 high/last week’s closing level). Below that level, 3,020/3,000 area (200-day SMA/psychological level) is a key support and as long as this level holds, the bullish outlook is likely to remain intact.
Resistances, on the other hand, could be seen at 3,234 (2019 closing level) and 3,300 (psychological level).
S&P 500 daily chart