- S&P 500 inches closer to 2019’s closing level of 3,234.
- Daily RSI is above 70 for the first time since late January.
The S&P 500 Index (SPX) last week gained nearly 5% and closed the third straight week in the negative territory on hopes of a strong economic recovery in the second half of the year. After rising 2.6% last Friday, the index extended its rally on Monday and touched its highest level since late February at 3,221 and was last seen up 0.75% on the day at 3,218.
S&P 500 technical outlook
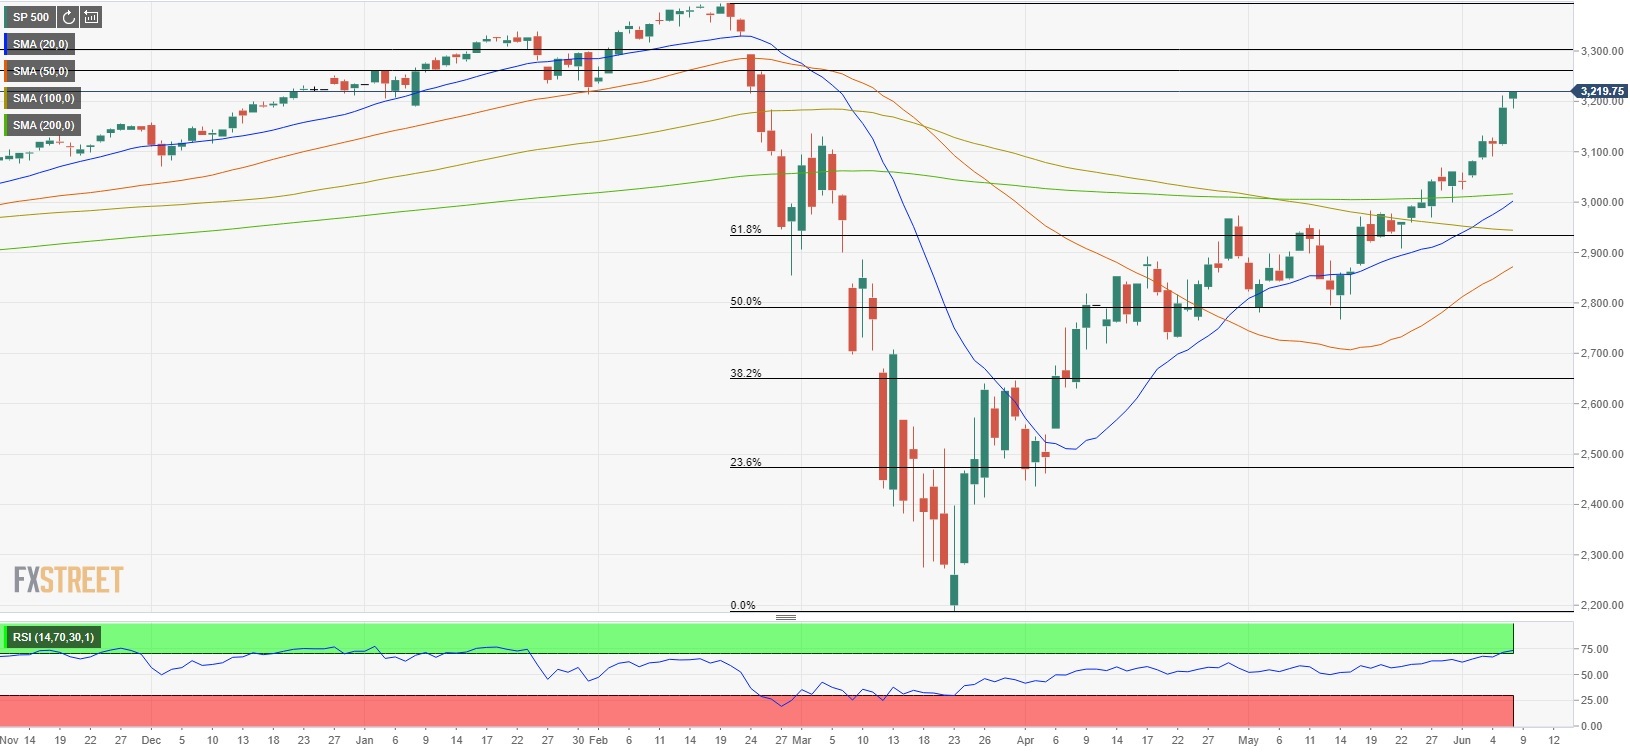
On the daily chart, the Relative Strength Index (RSI) rose above 70 for the first time since late January, suggesting that there could be a technical correction before the index continues to push higher. However, the 20-day SMA is about to make a bullish cross with the 200-day SMA, pointing out to a bullish outlook in the near-term.
On the upside, the initial resistance for the index aligns at 3,234 (2019 closing level) ahead of 3,300 (psychological level). On the downside, 3,180 (Feb. 26 high/last week’s closing level) could be seen as the first support before 3,020 (200-day SMA).
S&P 500 daily chart
 Additional technical levels
 Additional technical levels
