The S&P 500 Index has been able to move higher after the Federal Reserve delivered a dovish message, promising to do more if needed yet without a clear commitment. The Fed urged elected officials to provide further stimulus as negotiations continue on Capitol Hill.
Investors are now shifting their attention to the first release of the second-quarter Gross Domestic Product – peak impact of the pandemic. The economic calendar is showing a disastrous fall of around 34.1% annualized, yet the range is wide.
S&P 500 futures are on the back foot ahead of the historically-low figure, but technicals look better.
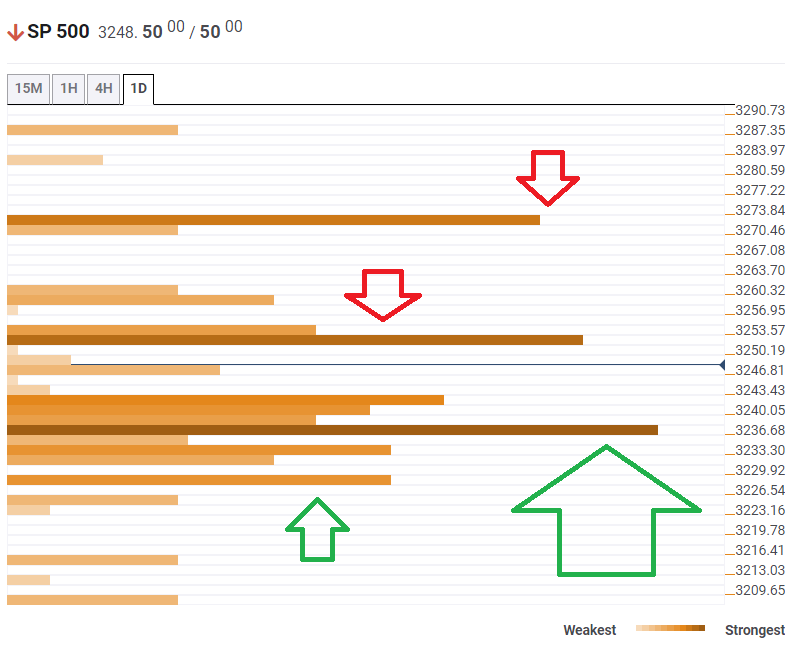
The Technical Confluences Indicator is showing that S&P 500 futures have strong support at 3,236, which is the convergence of the Simple Moving Average 50-1h, the Fibonacci 61.8% one-week, the SMA 200-15m, the Bollinger Band 1h-Middle, and more.
It is backed up by further clusters, with a noteworthy cushion at 3,226, which is where the Pivot Point one-month Resistance 1 and the previous daily low meet the price.
Looking up, an initial resistance is at 3,252, which is the confluence of the BB 1h-Upper, the previous yearly high, and the Fibonacci 38.2% one-week.
The upside target is 3,272, which is a juncture of lines including the Fibonacci 23.6% one-week, the PP one-week R1, and the PP one-day R2.
S&P 500 Chart
Here is how it looks on the tool:
Confluence Detector
The Confluence Detector finds exciting opportunities using Technical Confluences. The TC is a tool to locate and point out those price levels where there is a congestion of indicators, moving averages, Fibonacci levels, Pivot Points, etc. Knowing where these congestion points are located is very useful for the trader, and can be used as a basis for different strategies.
Learn more about Technical Confluence
