The S&P 500 Index has ended the second quarter of 2020 with the strongest gain since 1998. Can it continue higher? Perhaps not on the first day of the third quarter, which is showing that resistance is stronger than support.
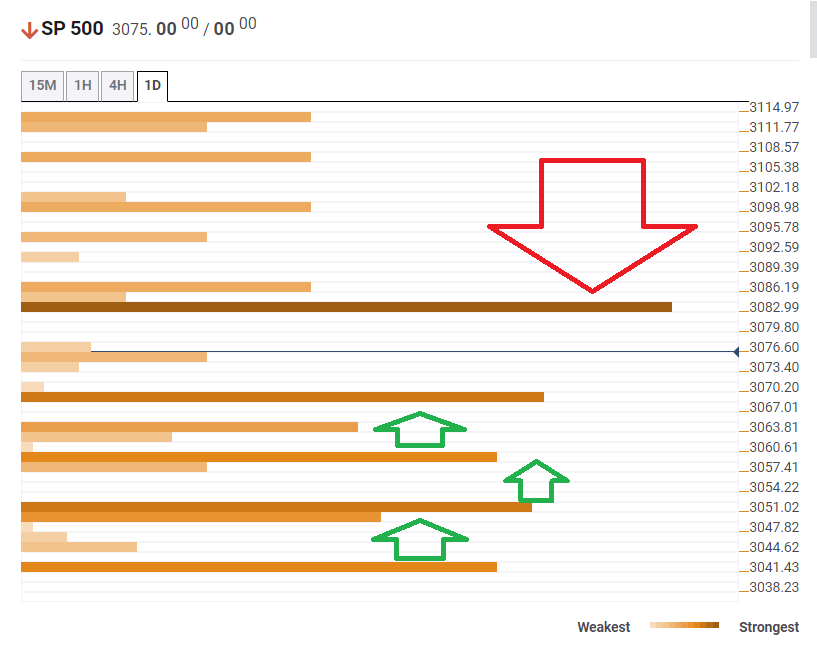
The Technical Confluences Indicator is showing that fierce resistance awaits the S&P 500 at 3,083, which is the convergence of the Simple Moving Average 10-one-day and the Bollinger Band 1h-Upper.
Several support lines are weaker than resistance but could cushion a fall. The first such support line awaits at 3,068, which is the meeting point of the previous 4h-low and the Fibonacci 38.2% one-day.
Further down, 3,059, which is where the Fibonacci 61.8% one-day and the SMA 5-one-day converge.
Another level to watch is 3,051, which is the confluence of the Fibonacci 61.8% one-month, the Bollinger Band 15min-Lower, and the BB 1h-Middle.
Here is how it looks on the tool:
Confluence Detector
The Confluence Detector finds exciting opportunities using Technical Confluences. The TC is a tool to locate and point out those price levels where there is a congestion of indicators, moving averages, Fibonacci levels, Pivot Points, etc. Knowing where these congestion points are located is very useful for the trader, and can be used as a basis for different strategies.
This tool assigns a certain amount of “weight” to each indicator, and this “weight” can influence adjacents price levels. These weightings mean that one price level without any indicator or moving average but under the influence of two “strongly weighted” levels accumulate more resistance than their neighbors. In these cases, the tool signals resistance in apparently empty areas.
Learn more about Technical Confluence
