- The bullish recovery sends the S&P 500 in 2.5-month highs.
- The S&P 500 is starting the New York session battling with the 3000 level.
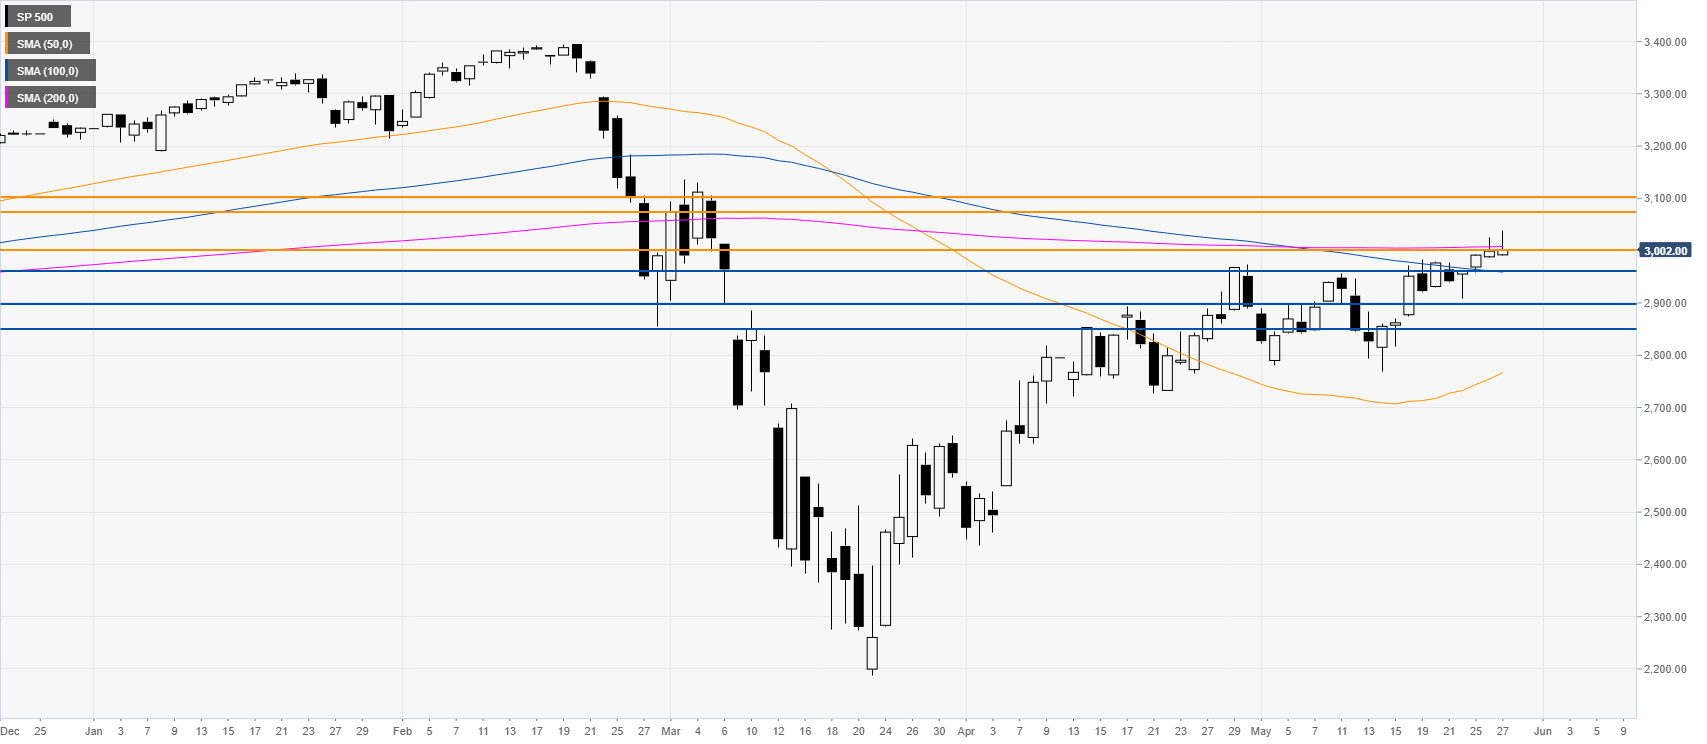
S&P 500 daily chart
After the February-March collapse, the S&P 500 is recovering a great part of the lost ground. The market is trading in 2.5-month highs above its main SMA on the daily chart. The index is battling with the critical 3000 mark. A daily close above the mentioned level could see an advance to the 3075/3100 price zone in the medium-term. On the flip side, support can be seen near the 2960 and 2900 levels initially.
Additional key levels
