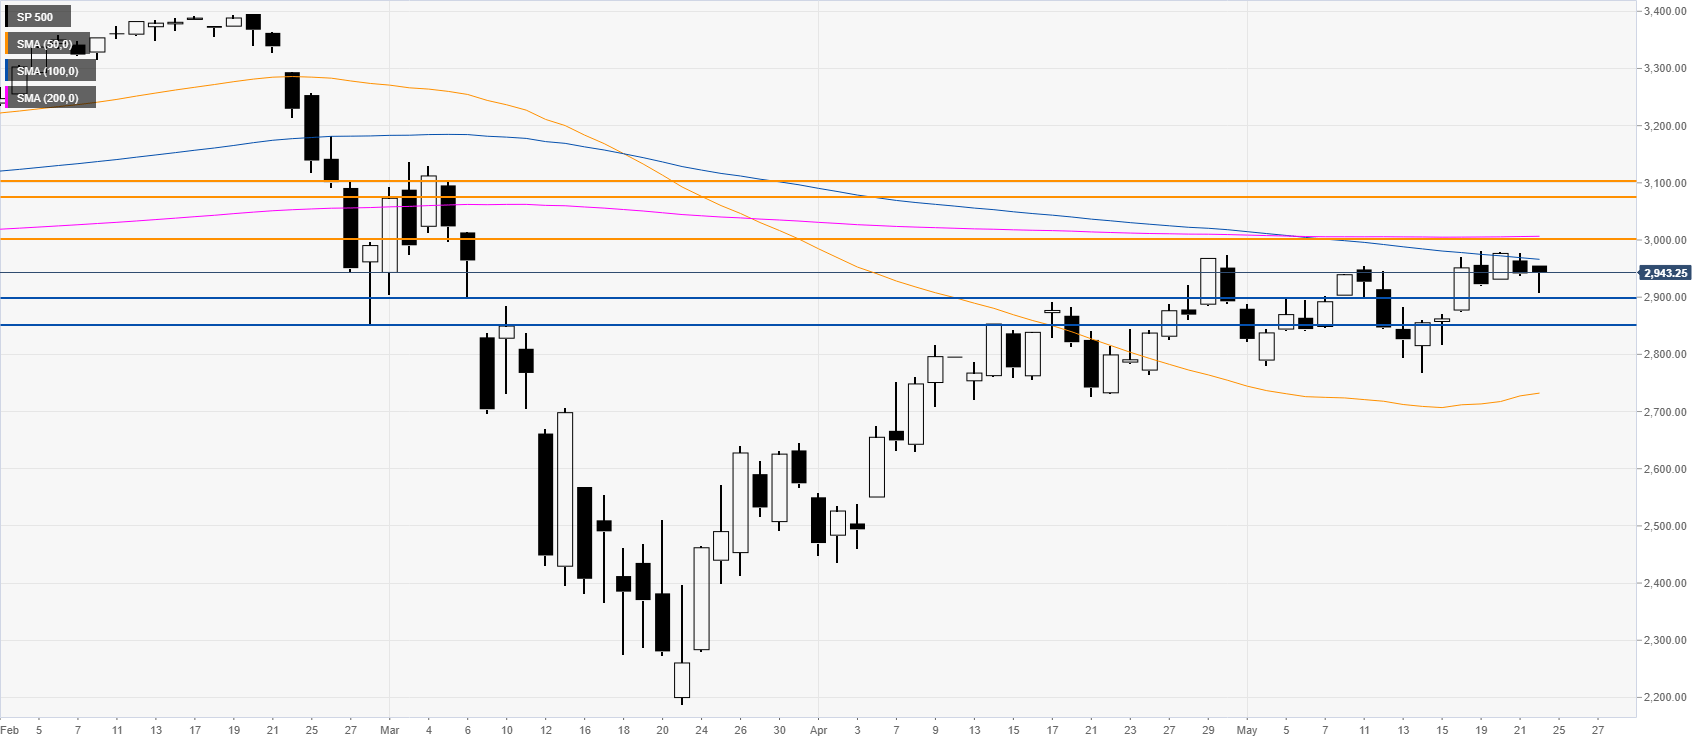
- S&P 500 bullish recovery from mid-March remains intact.
- The level to beat for buyers is the 3000 mark.
S&P 500 daily chart
Following the February-March collapse, the S&P 500 has been recovering most of its losses. The market is hovering near the May’s highs and the 100 SMA on the daily chart. As bulls stay firmly in control, a run to the 3000 figure could be on the cards. Further gains above the mentioned level can see the S&P 500 reach the 3075/3100 price zone in the medium-term. On the other hand, support can be seen near the 2900 and 2850 levels.
Additional key levels
