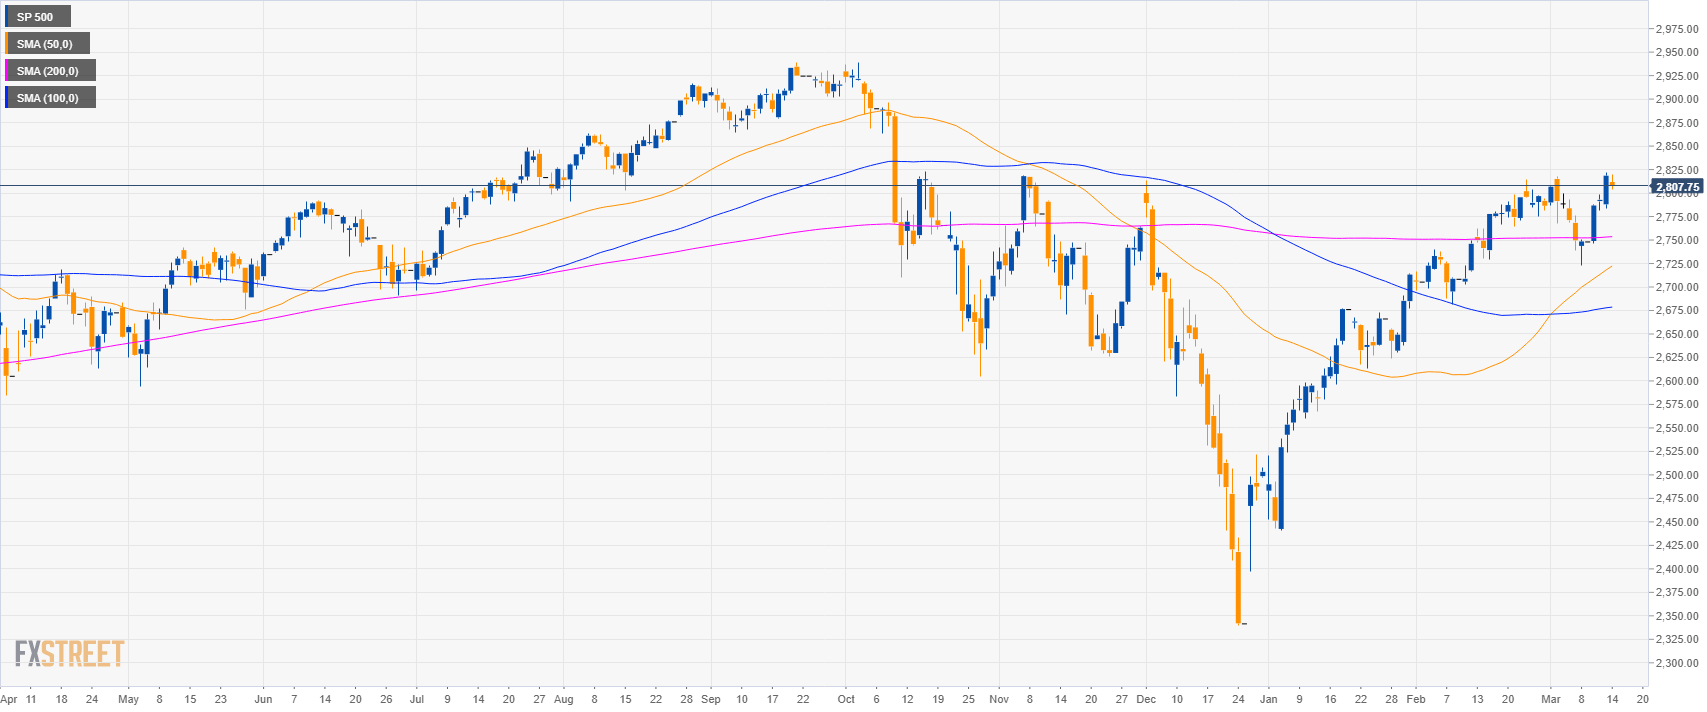
S&P500 daily chart
- The S&P500 is trading above its main simple moving average suggesting bullish momentum.
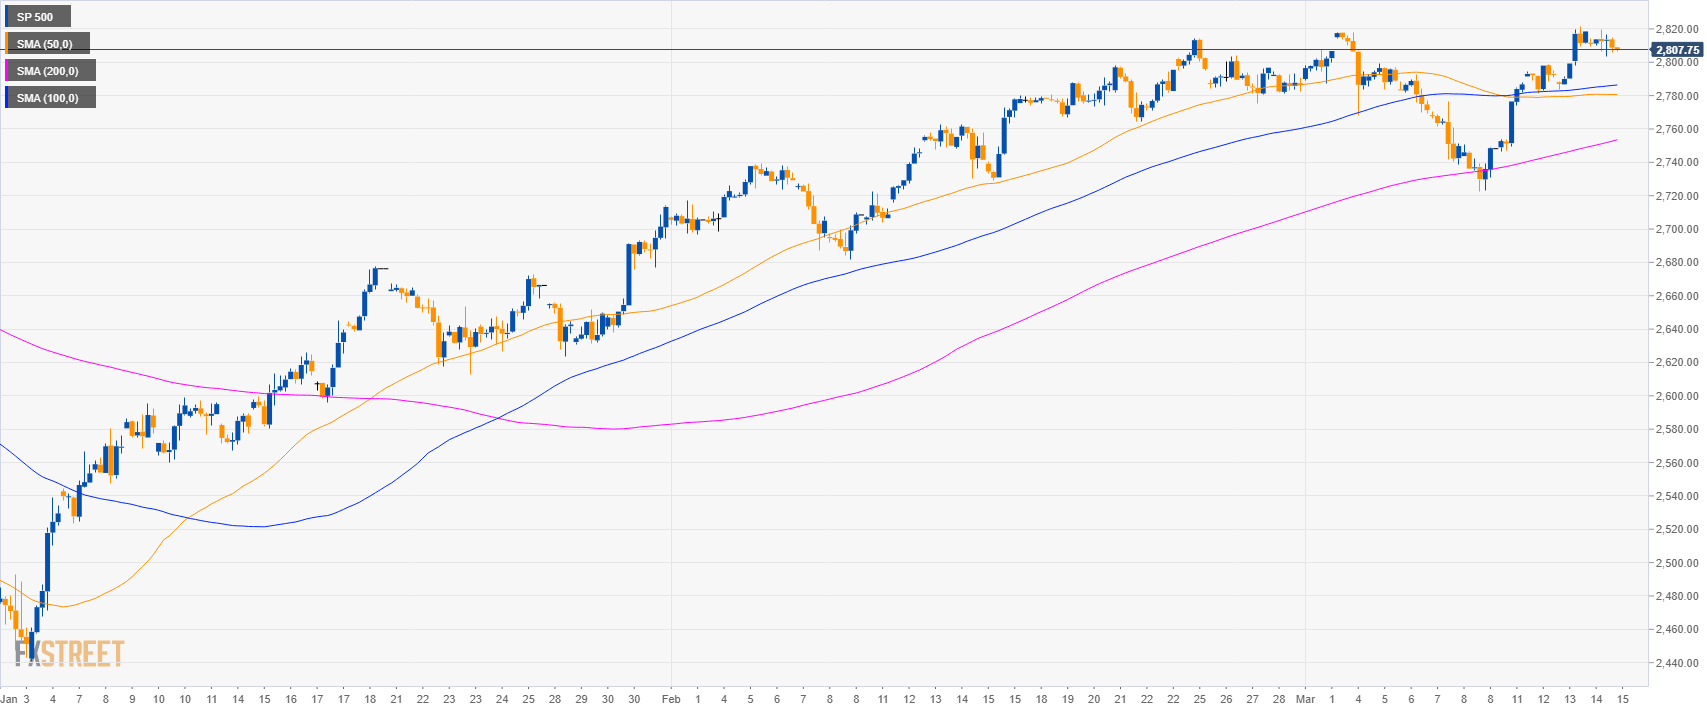
S&P500 4-hour chart
- The S&P500 is trading above its main SMAs suggesting bullish momentum in the medium-term.
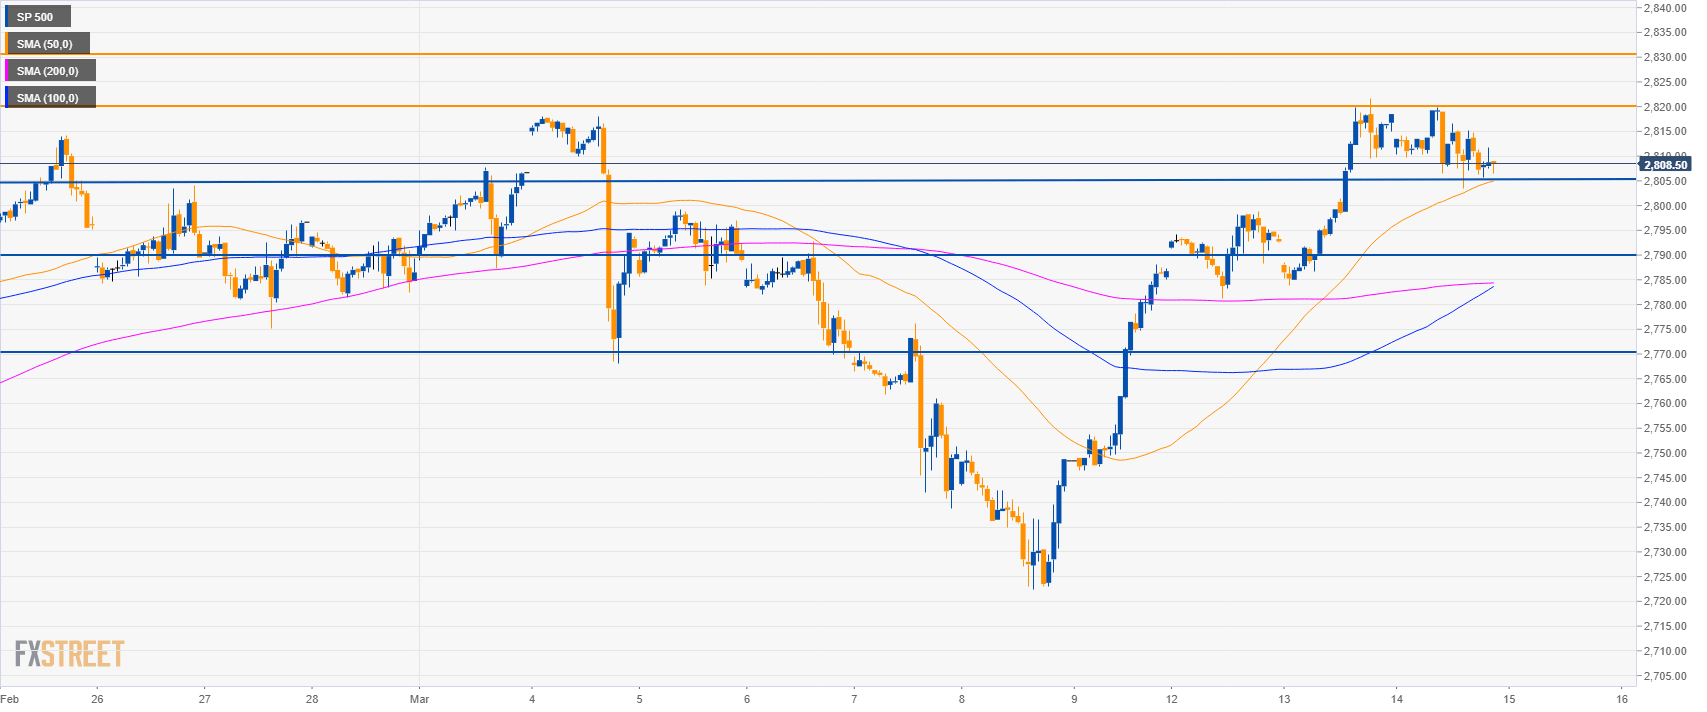
S&P500 60-minute chart
- The S&P500 is trading above its main SMAs suggesting bullish momentum in the short-term.
- However, a break below 2,805.00 support can lead to 2,790.00 level.
- Resistances are at 2,820.00 and 2,830.00 level.
Additional key levels
SP 500
Overview:
Today Last Price: 2807.75
Today Daily change: -10.75 points
Today Daily change %: -0.38%
Today Daily Open: 2818.5
Trends:
Daily SMA20: 2783.2
Daily SMA50: 2718.14
Daily SMA100: 2677.84
Daily SMA200: 2753.17
Levels:
Previous Daily High: 2821.75
Previous Daily Low: 2783.75
Previous Weekly High: 2818
Previous Weekly Low: 2722.5
Previous Monthly High: 2814.25
Previous Monthly Low: 2681.75
Daily Fibonacci 38.2%: 2807.23
Daily Fibonacci 61.8%: 2798.27
Daily Pivot Point S1: 2794.25
Daily Pivot Point S2: 2770
Daily Pivot Point S3: 2756.25
Daily Pivot Point R1: 2832.25
Daily Pivot Point R2: 2846
Daily Pivot Point R3: 2870.25
