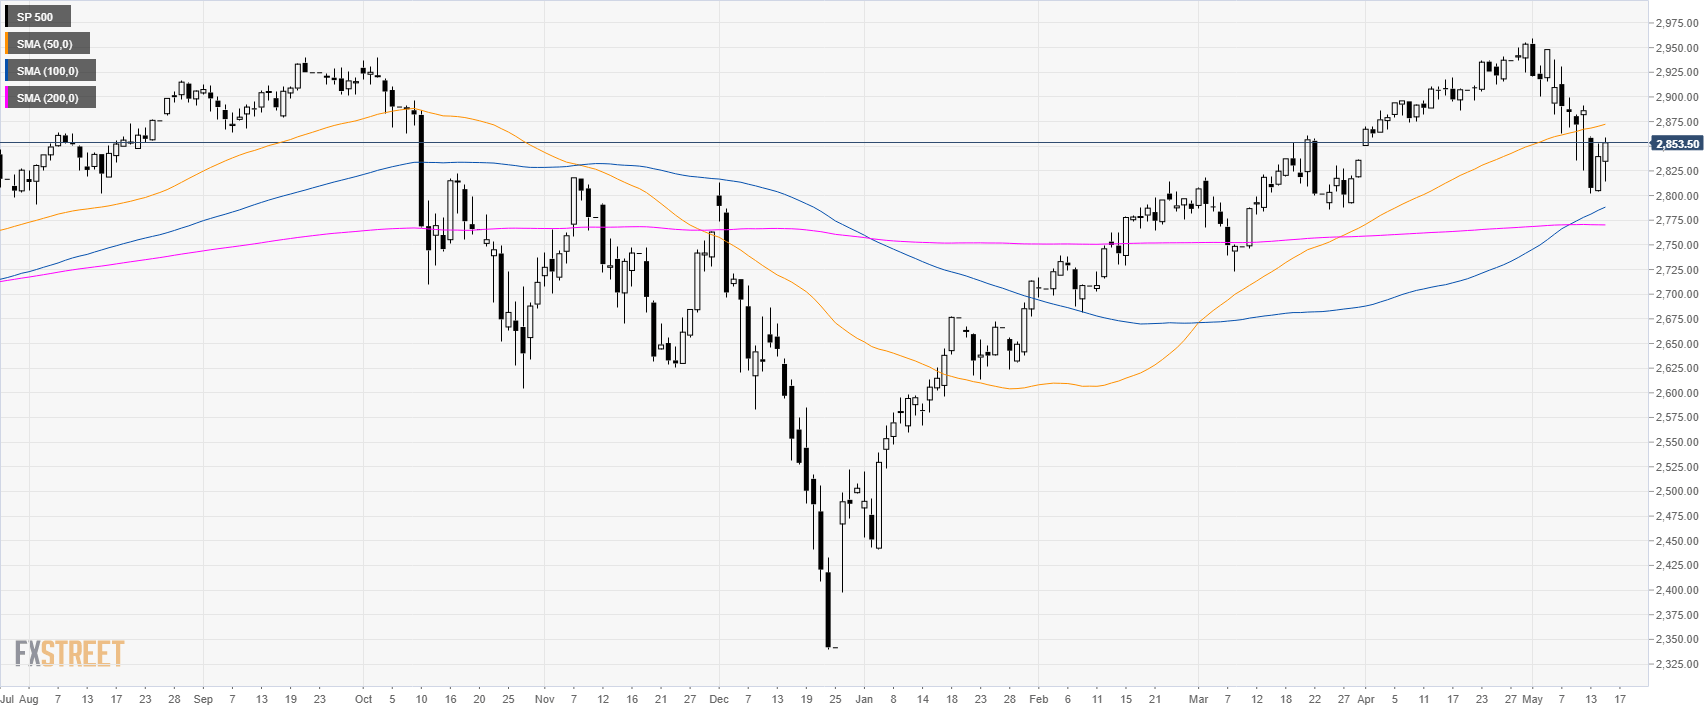
S&P500 daily chart
The S&P500 Index is trading in a bull trend above its 200-period simple moving averages (SMA). The market found some support above the 2,800.00 figure on Tuesday and is having some follow-through on Wednesday. US President Trump will delay tariffs on autos and the market interpreted the comment as bullish.
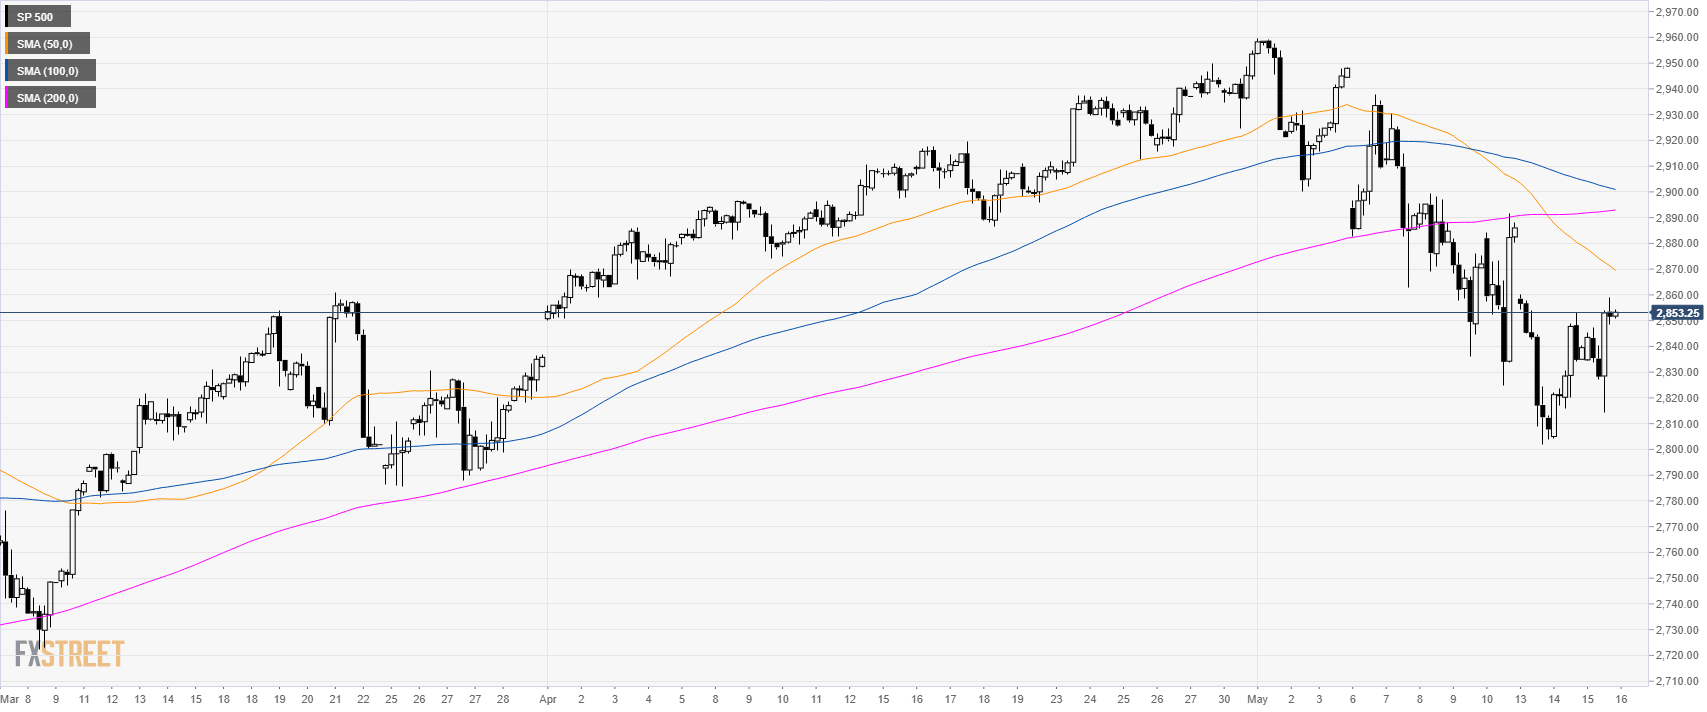
S&P500 4-hour chart
The market is trading below its main SMAs suggesting a consolidation phase in the medium term.
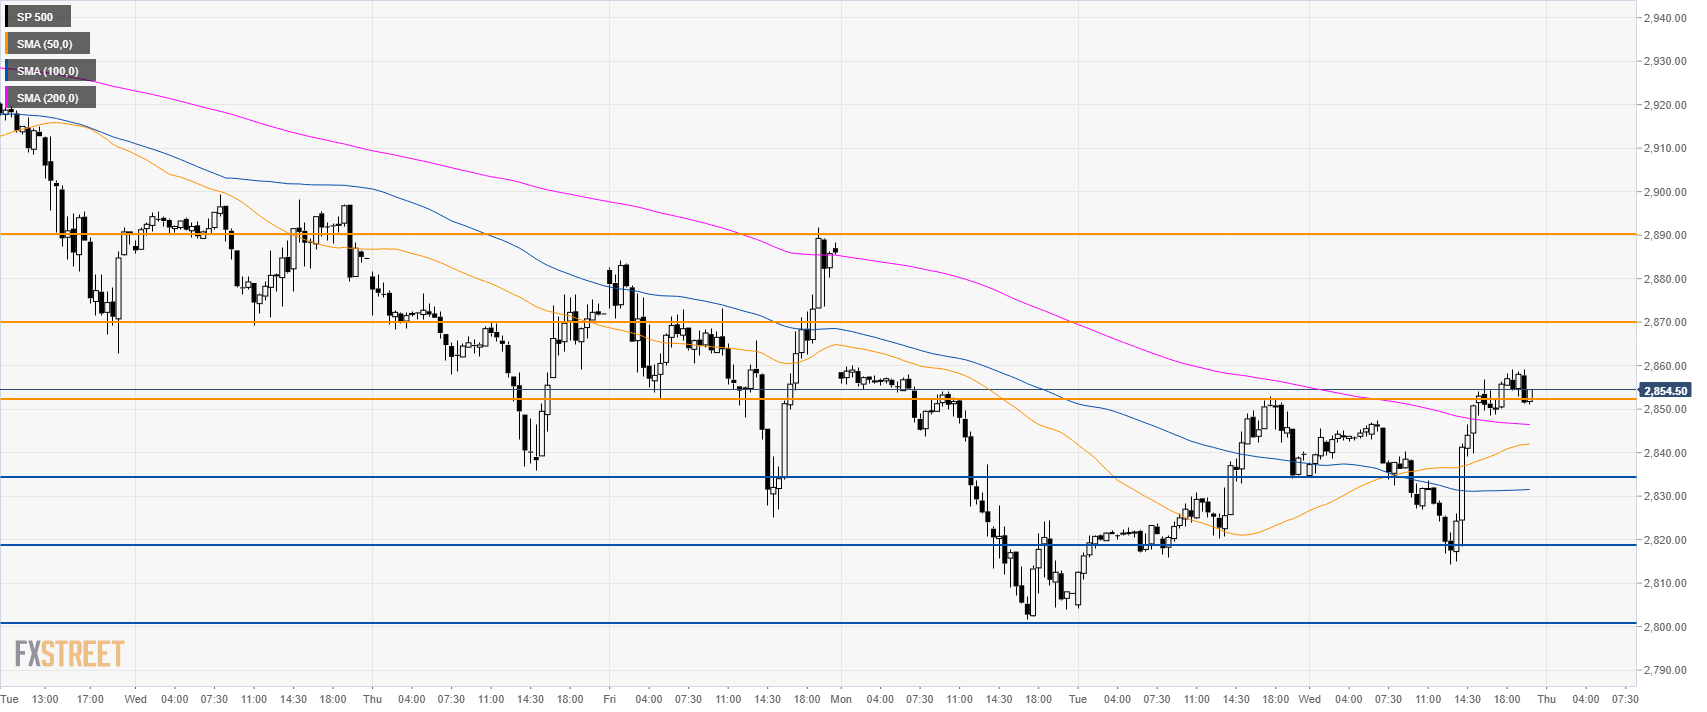
S&P500 30-minute chart
The index is trading above the 2,850.00 mark and its simple main SMAs suggesting bullish momentum in the near term. Bulls can target 2,870.00 and 2,890.00 to the upside. Support is seen at 2835 andb 2820.00 price level.
Additional key levels
