- The S&P 500 is down more than 15% in only seven days.
- The S&P 500 is trading below the 200-day simple moving average (DMA).
- The Coronavirus spread is sending global markets into panic.
S&P 500 daily chart
Sellers are selling the American stock index relentlessly. The benchmark is about to records its worst monthly decline since May 2019. The S&P500 is now trading below the critical 200-day simple moving average (DMA) as the market is challenging the 2900 support level. The spread of the Coronavirus is making traders worried about the heath of the global economy. The path of least resistance remains down with 2800 and 2700 as potential targets.
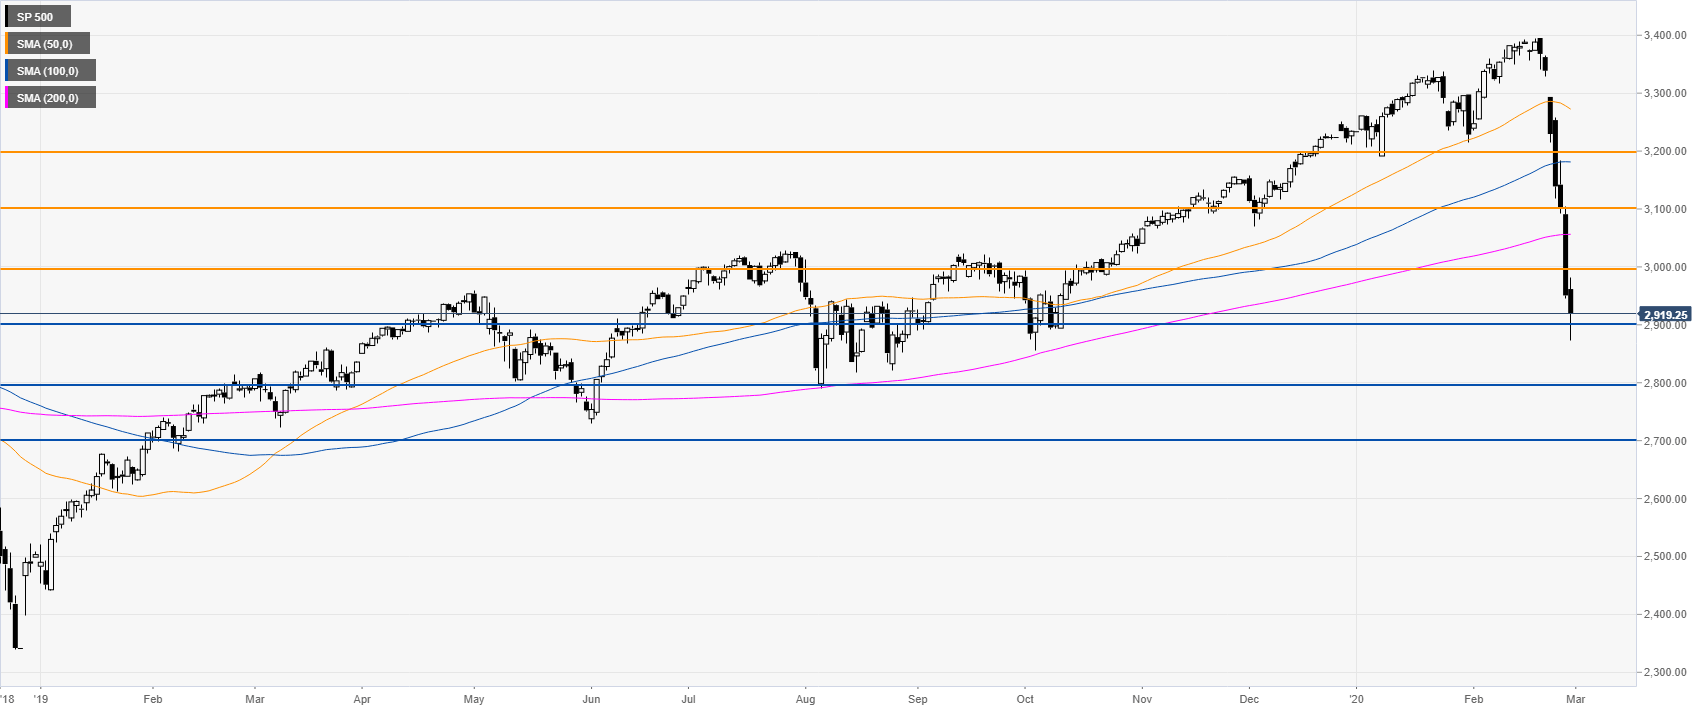
Additional key levels
