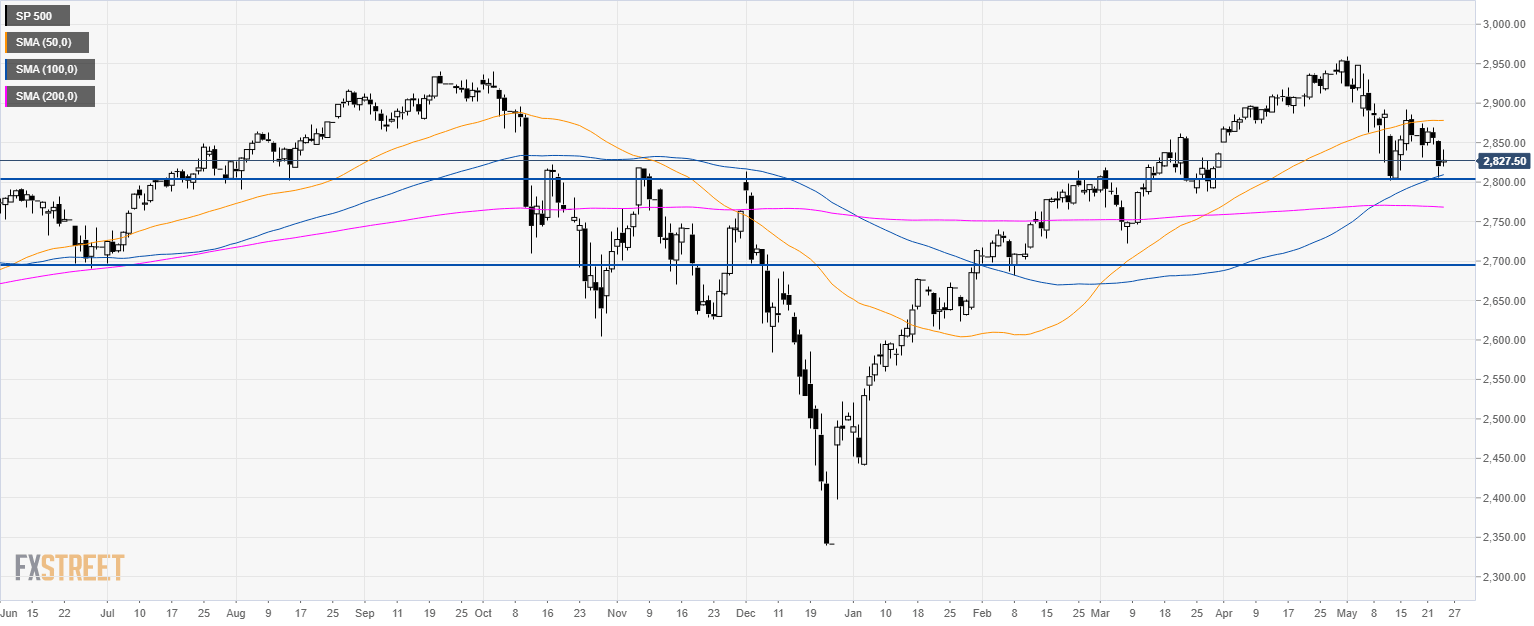
S&P500 daily chart
The S&P500 Index is in a bull trend above its 100 and 200-period simple moving averages (SMAs). However the bears are close to threatening an important support at 2,800.00. A break below this level can send the index towards the 2,700.00 figure.
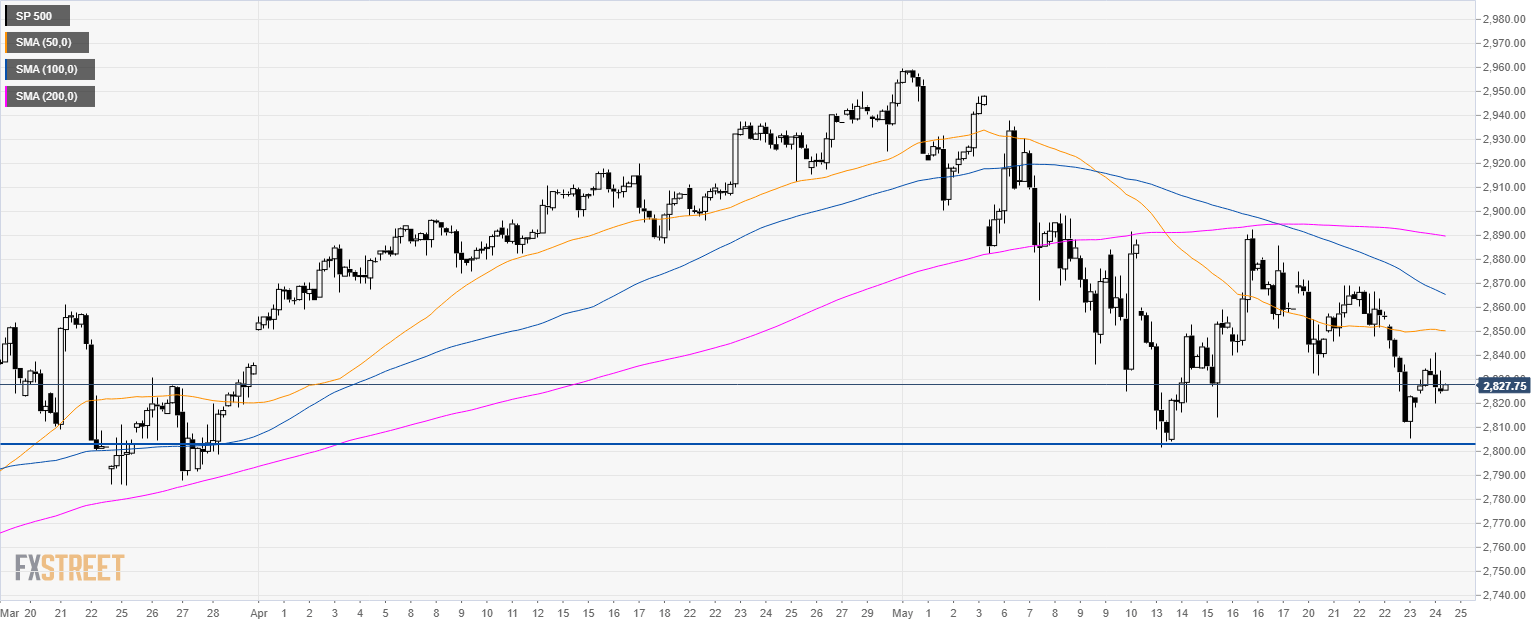
S&P500 4-hour chart
The market is trading below its main SMAs as the index keeps the bearish pressure near 2,800.00 level.
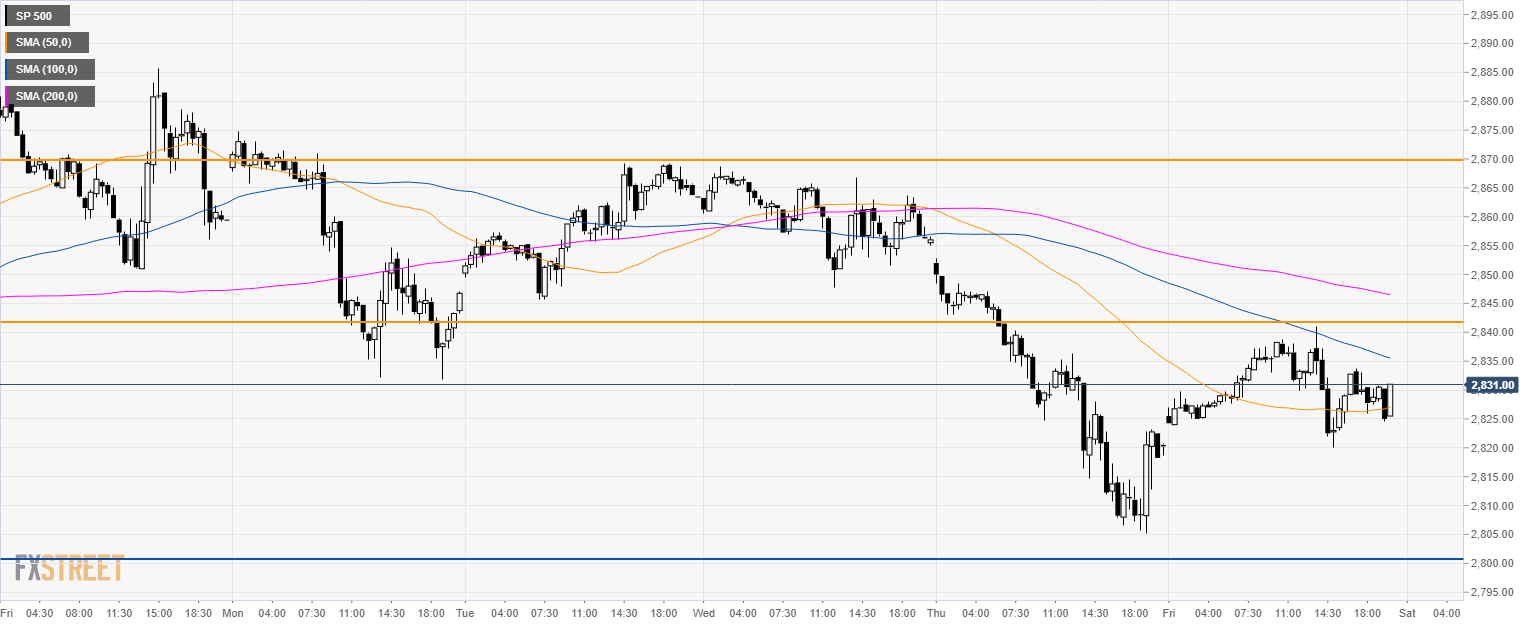
S&P500 30-minute chart
The S&P500 is trading below its 100 and 200 SMAs suggesting bearish momentum in the near term. If bears break 2,800.00 then 2,760.0; 2,720.00 and 2700.00 can enter into play. However, if bulls can bring the market back above 2,840.00 resistance we could see another attempt at 2,870.00 to the upside.
Additional key levels
