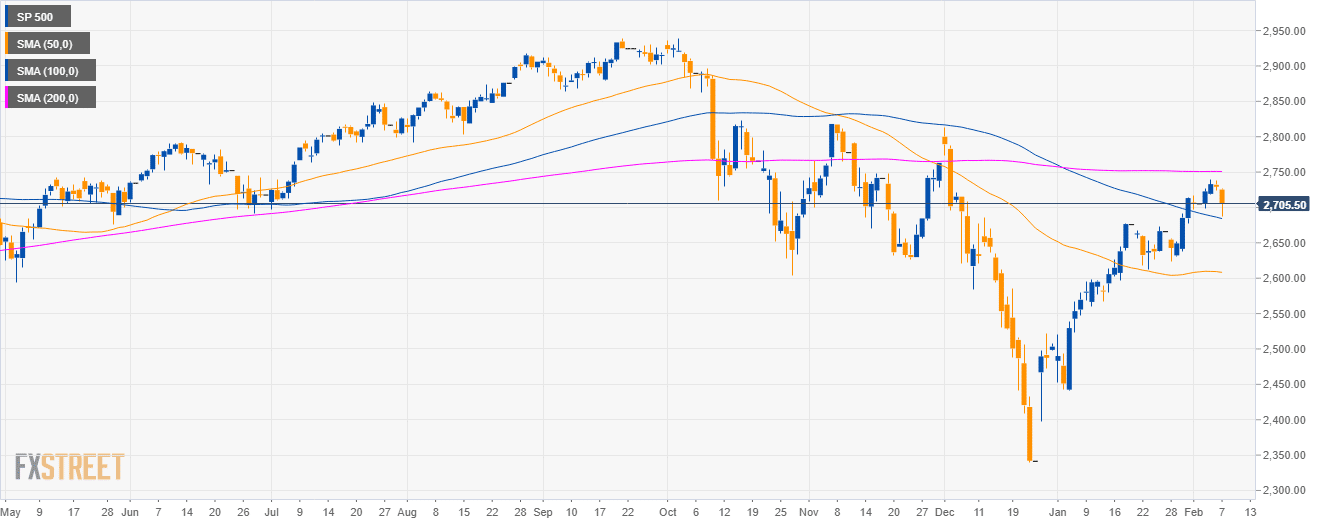
S&P500 daily chart
- The S&P500 Index is having a strong bullish reversal after a deep pullback below the 200-day simple moving average (DSMA).
- Bears challenged the 100 DSMA.
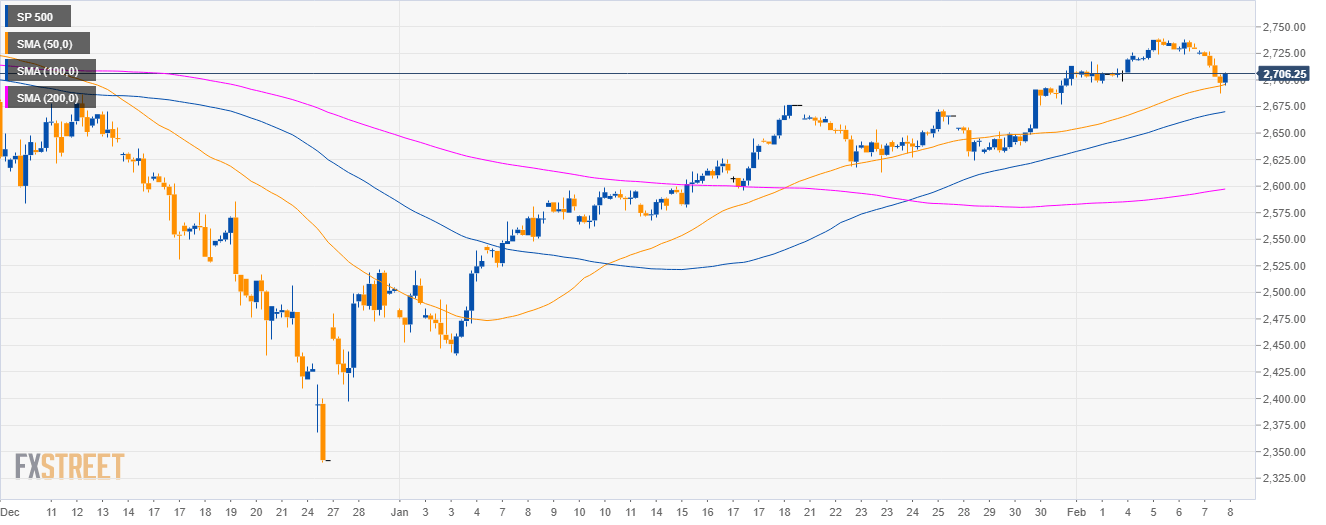
S&P500 4-hour chart
- The market found some support near the 2,700 figure and the 50 SMA.
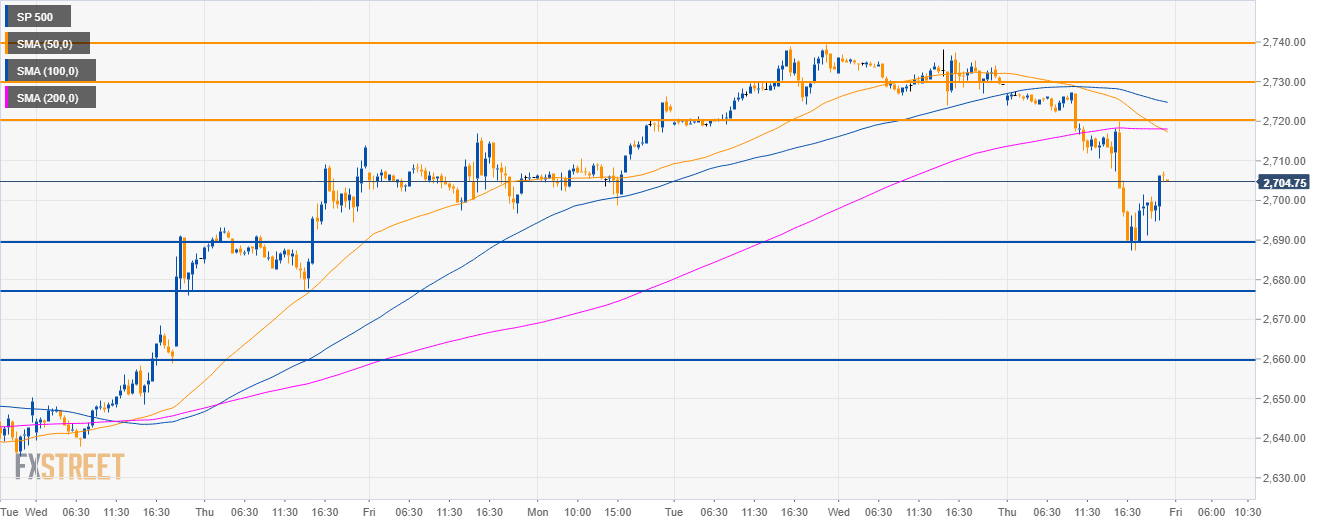
S&P500 30-minute chart
- The S&P500 is trading below the main SMAs suggesting bearish momentum.
- However, as the market found support at 2,690.00 level, bulls can drive the market to 2,720.00 and 2,730.00 in the short-term.
- To the downside, support is seen at 2,690.00, 2,680.00 and 2,660.00 levels.
Additional key levels
SP 500
Overview:
Today Last Price: 2706.25
Today Daily change: -23.00 points
Today Daily change %: -0.84%
Today Daily Open: 2729.25
Trends:
Daily SMA20: 2670.18
Daily SMA50: 2609.37
Daily SMA100: 2686.33
Daily SMA200: 2750.95
Levels:
Previous Daily High: 2738
Previous Daily Low: 2724
Previous Weekly High: 2717
Previous Weekly Low: 2623.75
Previous Monthly High: 2714
Previous Monthly Low: 2441
Daily Fibonacci 38.2%: 2729.35
Daily Fibonacci 61.8%: 2732.65
Daily Pivot Point S1: 2722.83
Daily Pivot Point S2: 2716.42
Daily Pivot Point S3: 2708.83
Daily Pivot Point R1: 2736.83
Daily Pivot Point R2: 2744.42
Daily Pivot Point R3: 2750.83
