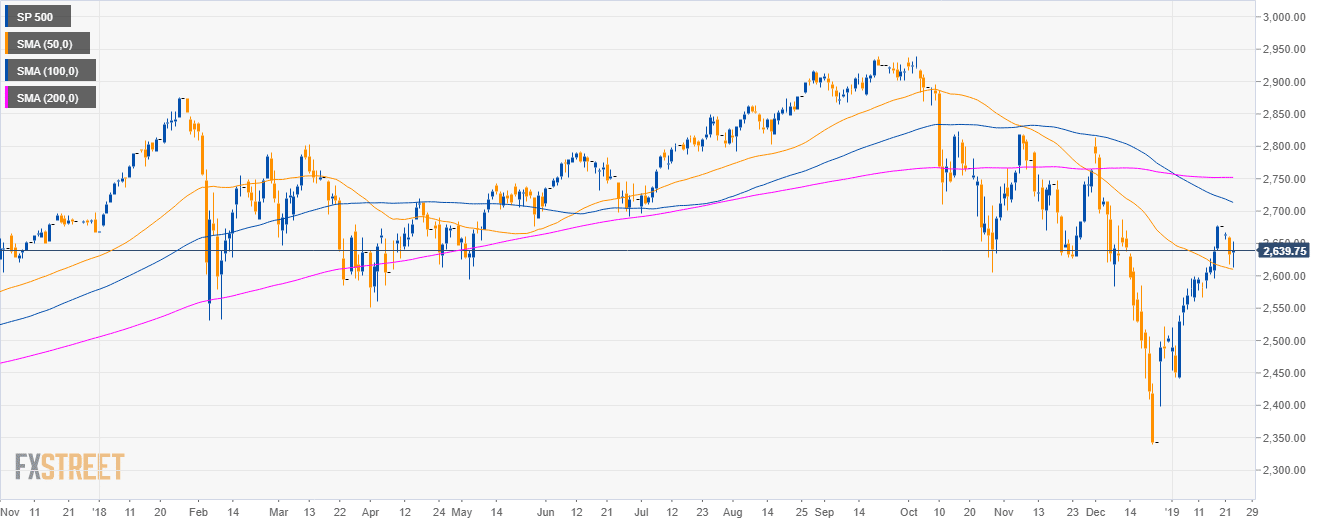
S&P500 daily chart
- The S&P500 Index is having a deep pullback below the 100 and 200-day simple moving averages (SMAs).
- Bulls have momentarily retaken the 50 SMA.
S&P500 4-hour chart
- The S&P500 is evolving the main SMAs suggesting bullish momentum in the medium-term.

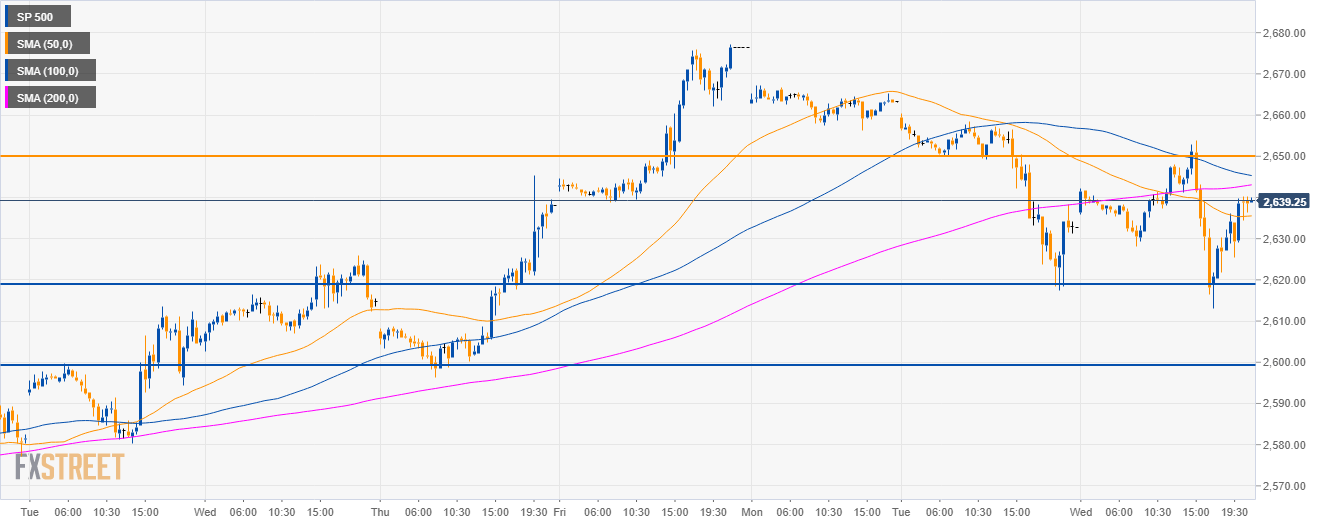
S&P500 30-minute chart
- The S&P500 broke below the 2,650.00 level and the 200 SMA suggesting bearish momentum in the near-term.
- A decline below the 2,620.00 support can lead to the 2,600.00 figure to the downside.
- The 2,650.00 level is resistance.
Additional key levels
SP 500
Overview:
Today Last Price: 2638.5
Today Daily change: 5.75 points
Today Daily change %: 0.22%
Today Daily Open: 2632.75
Trends:
Daily SMA20: 2563.76
Daily SMA50: 2611.31
Daily SMA100: 2715.91
Daily SMA200: 2752.02
Levels:
Previous Daily High: 2660.5
Previous Daily Low: 2617.5
Previous Weekly High: 2677.25
Previous Weekly Low: 2567.25
Previous Monthly High: 2813.5
Previous Monthly Low: 2340.25
Daily Fibonacci 38.2%: 2633.93
Daily Fibonacci 61.8%: 2644.07
Daily Pivot Point S1: 2613.33
Daily Pivot Point S2: 2593.92
Daily Pivot Point S3: 2570.33
Daily Pivot Point R1: 2656.33
Daily Pivot Point R2: 2679.92
Daily Pivot Point R3: 2699.33
