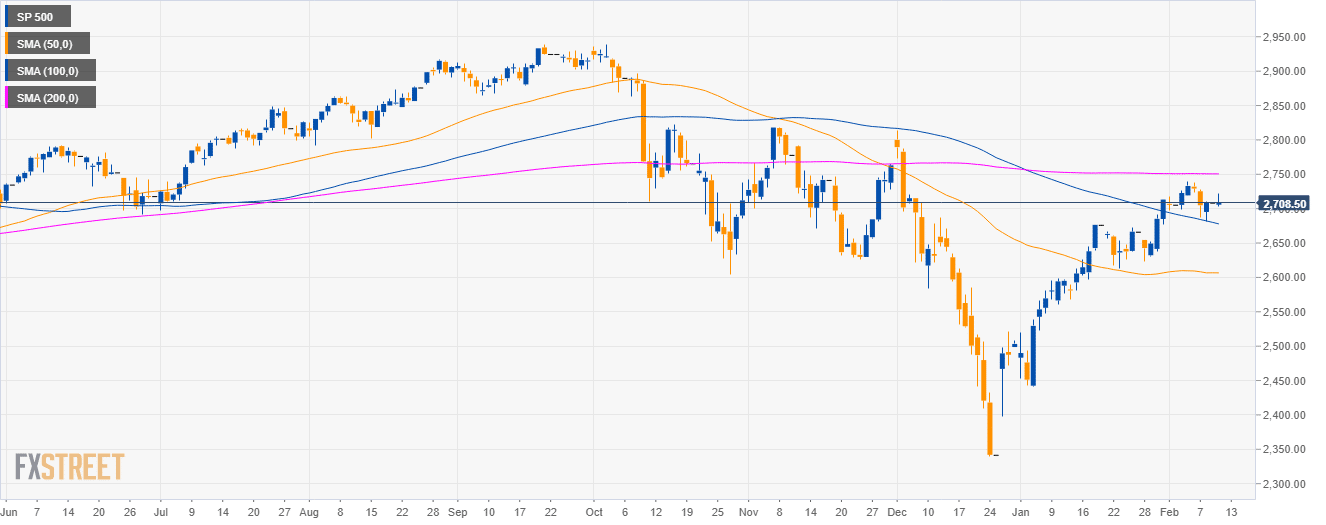
S&P500 daily chart
- The S&P500 Index is trading between the 100 and 200-day simple moving averages (SMAs) suggesting a sideways market.
- As discussed last Thursday, the market hit the 2,720.00 level to the upside.
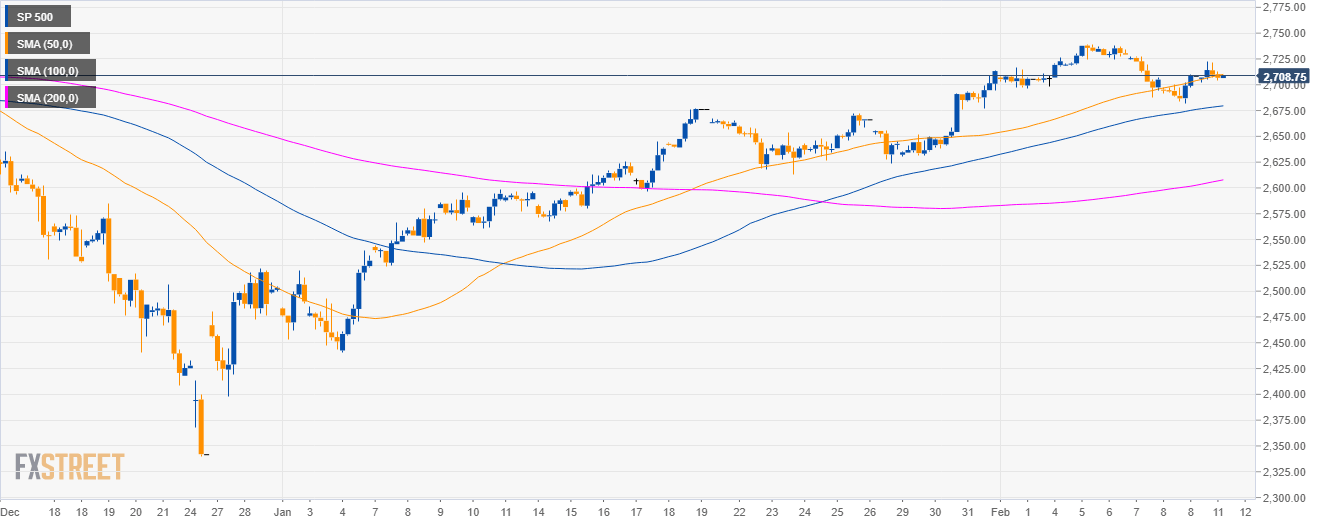
S&P500 4-hour chart
- The market found some support near the 2,700 figure and the 50 SMA.
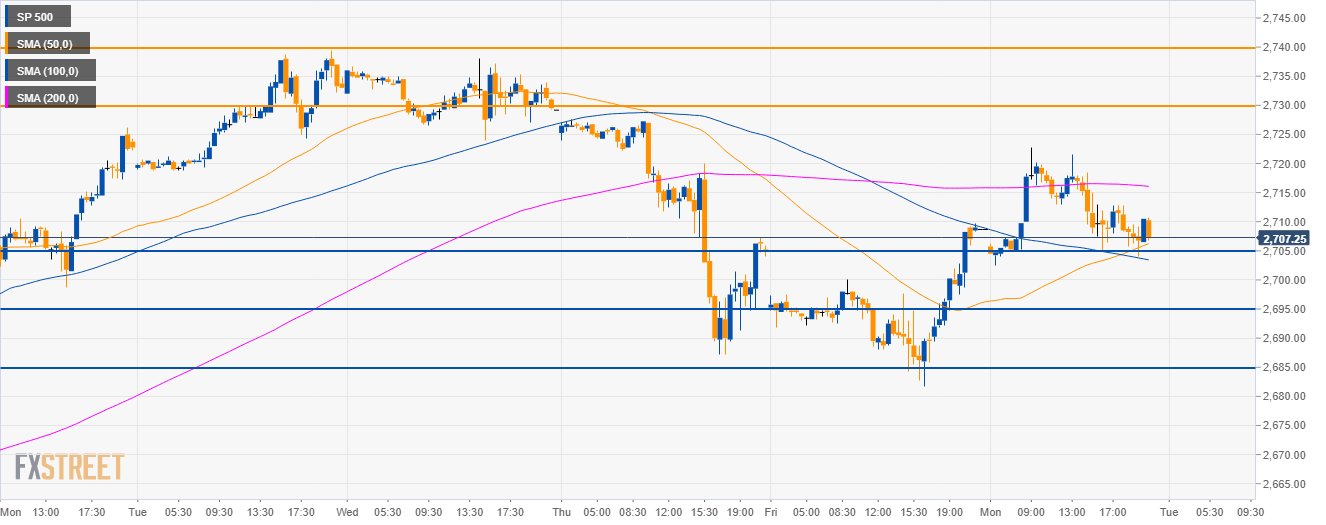
S&P500 30-minute chart
- The S&P500 is trading between the 100 and 200 SMAs suggesting a sideways market.
- The 2,730.00 resistance is the level to beat if bull want to continue the recent up move towards, 2,740.00 and 2,800.00 figure
- On the way down, supports are seen at 2,705.00, 2,695.00 and 2,685.00 levels.
Additional key levels
SP 500
Overview:
Today Last Price: 2710.5
Today Daily change %: 0.06%
Today Daily Open: 2708.75
Trends:
Daily SMA20: 2683.38
Daily SMA50: 2606.74
Daily SMA100: 2680
Daily SMA200: 2750.66
Levels:
Previous Daily High: 2708.75
Previous Daily Low: 2708.75
Previous Weekly High: 2739.5
Previous Weekly Low: 2681.75
Previous Monthly High: 2714
Previous Monthly Low: 2441
Daily Fibonacci 38.2%: 2708.75
Daily Fibonacci 61.8%: 2708.75
Daily Pivot Point S1: 2708.75
Daily Pivot Point S2: 2708.75
Daily Pivot Point S3: 2708.75
Daily Pivot Point R1: 2708.75
Daily Pivot Point R2: 2708.75
Daily Pivot Point R3: 2708.75
