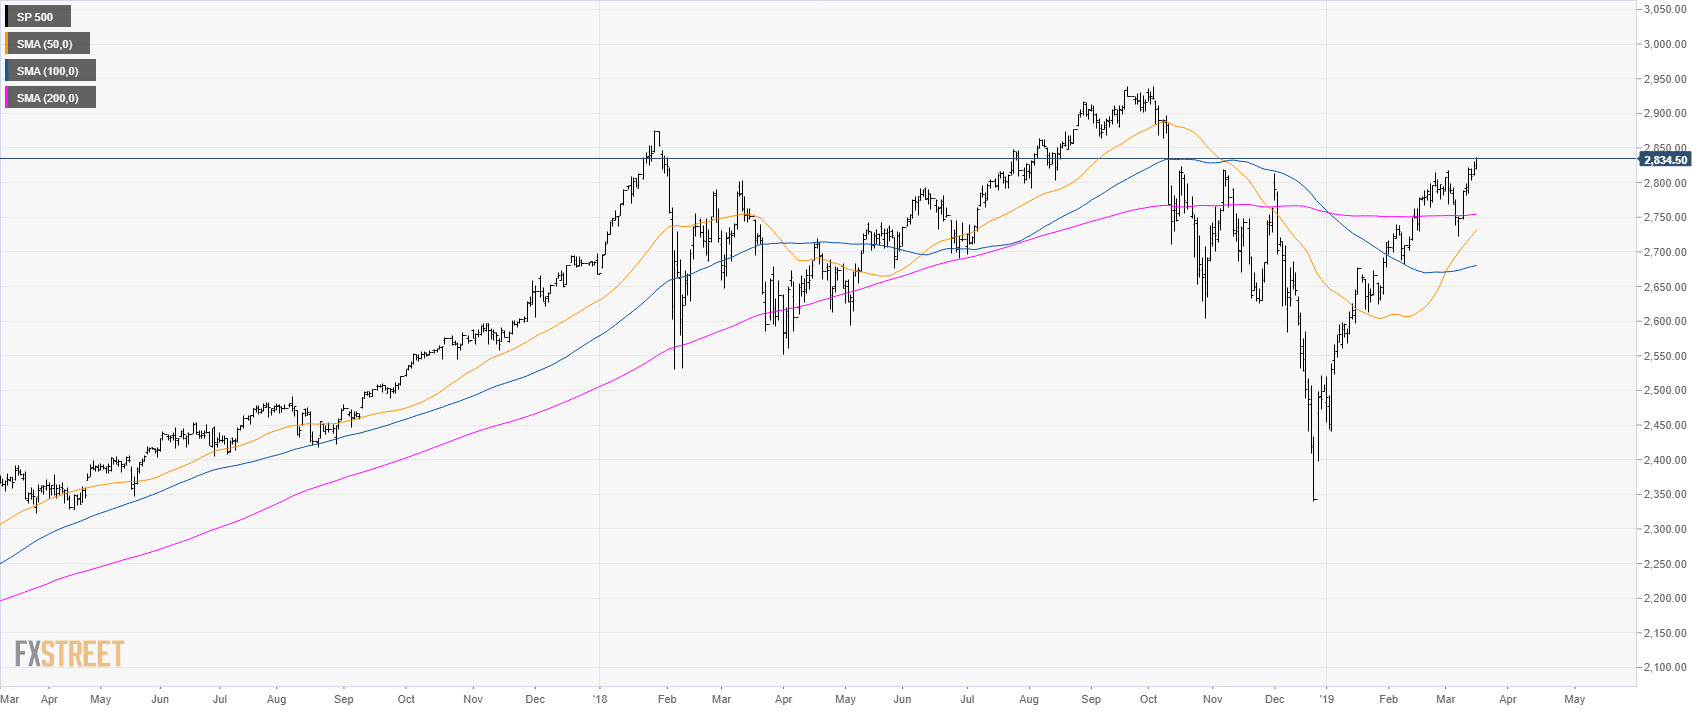
S&P500 daily chart
- The S&P500 is trading above its main simple moving average suggesting bullish momentum.
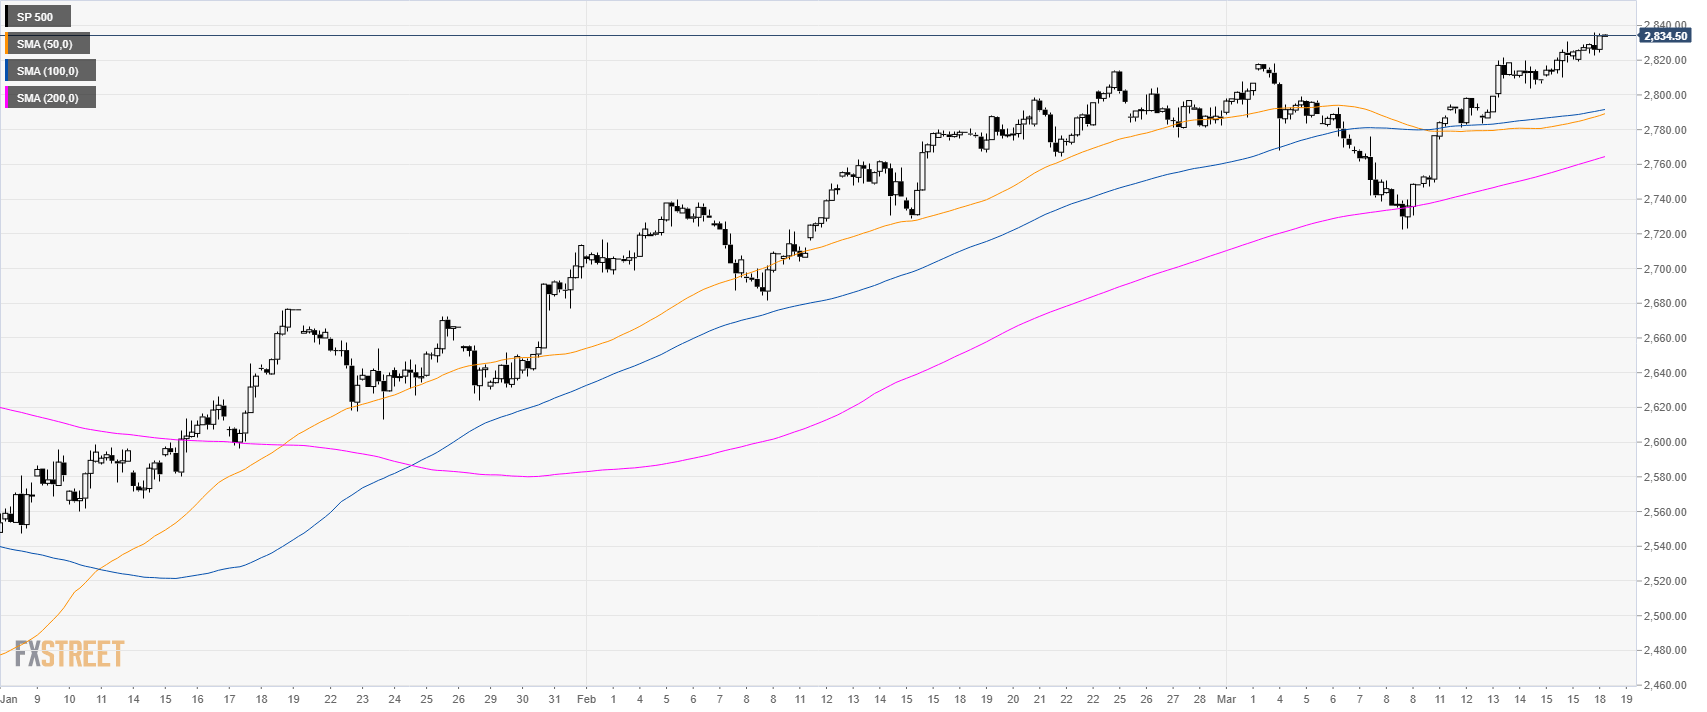
S&P500 4-hour chart
- The S&P500 is trading above its main SMAs suggesting bullish momentum in the medium-term.
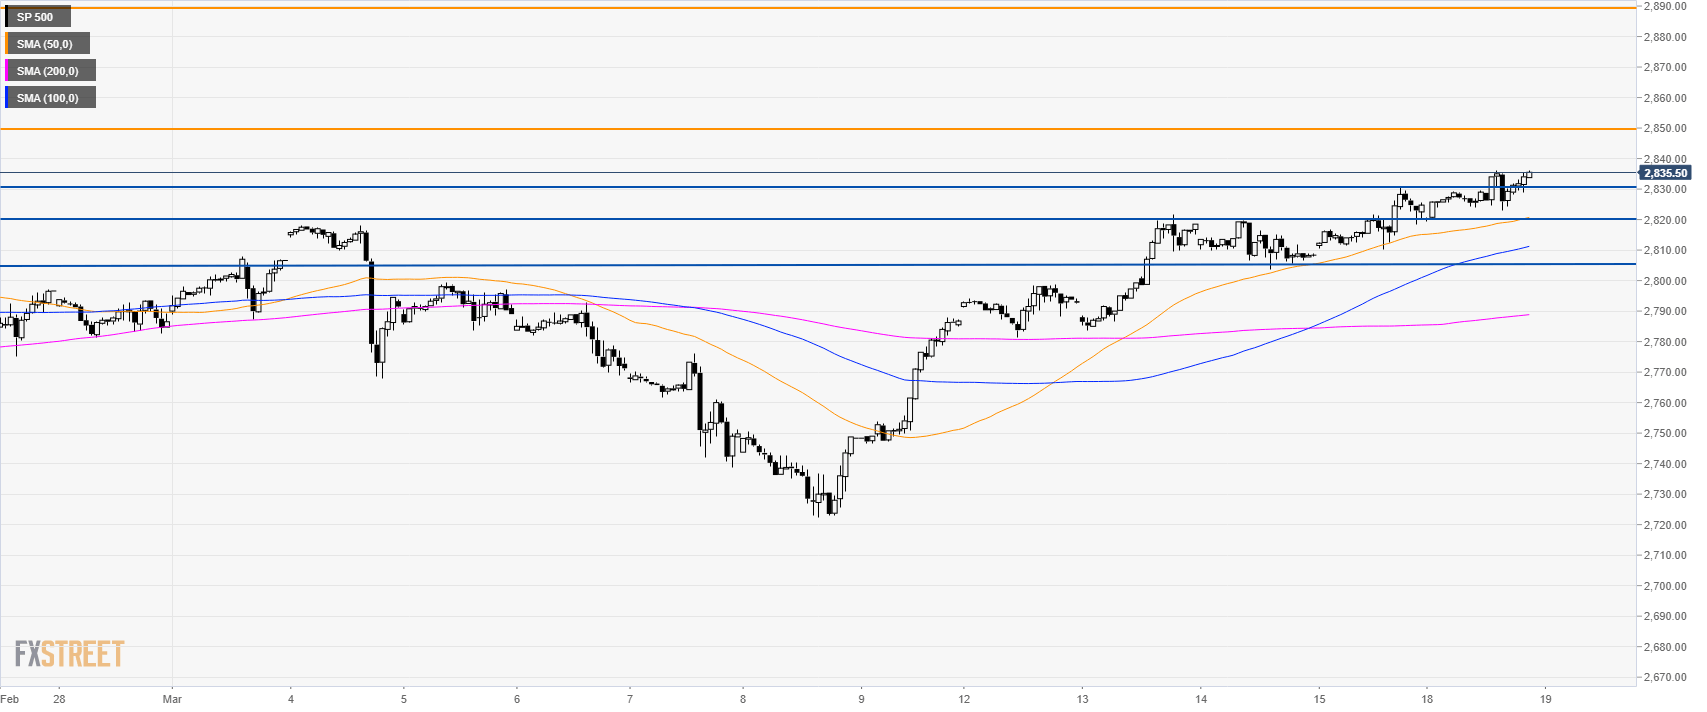
S&P500 60-minute chart
- The S&P500 is trading above its main SMAs suggesting bullish momentum in the short-term.
- The break above 2,830.00 can lead to 2,850.00 and 2,890 resistances.
- Support is at 2,830.00; 2,820.00 and 2,805.00 level.
Additional key levels
SP 500
Overview:
Today Last Price: 2834
Today Daily change: 9.25 points
Today Daily change %: 0.33%
Today Daily Open: 2824.75
Trends:
Daily SMA20: 2787.06
Daily SMA50: 2727.02
Daily SMA100: 2679.67
Daily SMA200: 2754.21
Levels:
Previous Daily High: 2831
Previous Daily Low: 2810.25
Previous Weekly High: 2831
Previous Weekly Low: 2746.5
Previous Monthly High: 2814.25
Previous Monthly Low: 2681.75
Daily Fibonacci 38.2%: 2823.07
Daily Fibonacci 61.8%: 2818.18
Daily Pivot Point S1: 2813
Daily Pivot Point S2: 2801.25
Daily Pivot Point S3: 2792.25
Daily Pivot Point R1: 2833.75
Daily Pivot Point R2: 2842.75
Daily Pivot Point R3: 2854.5
