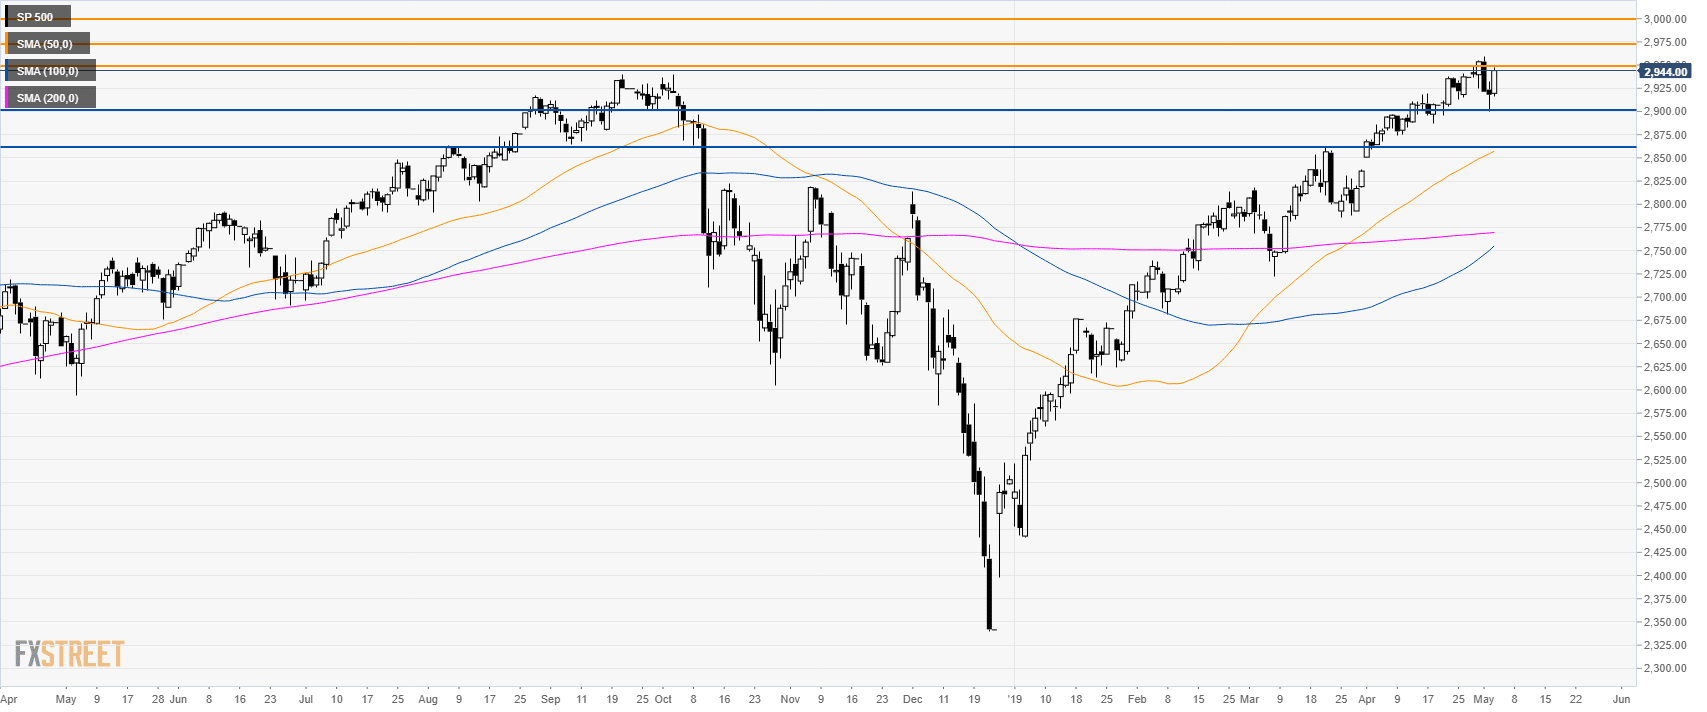
S&P500 daily chart
- The market is challenging the 2,948.00 resistance.
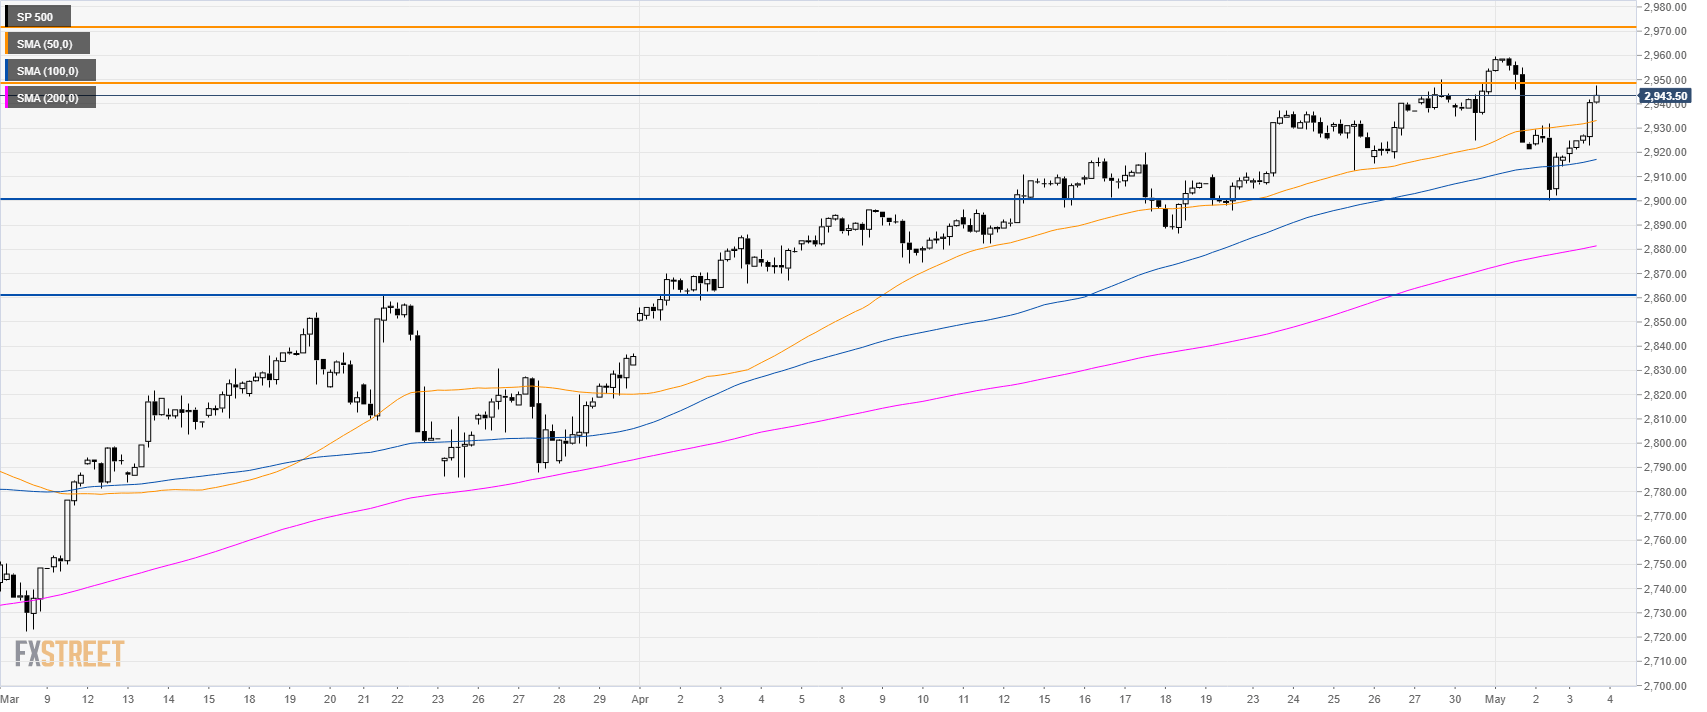
S&P500 4-hour chart
- The market is trading above its main SMAs suggesting bullish momentum in the medium-term.
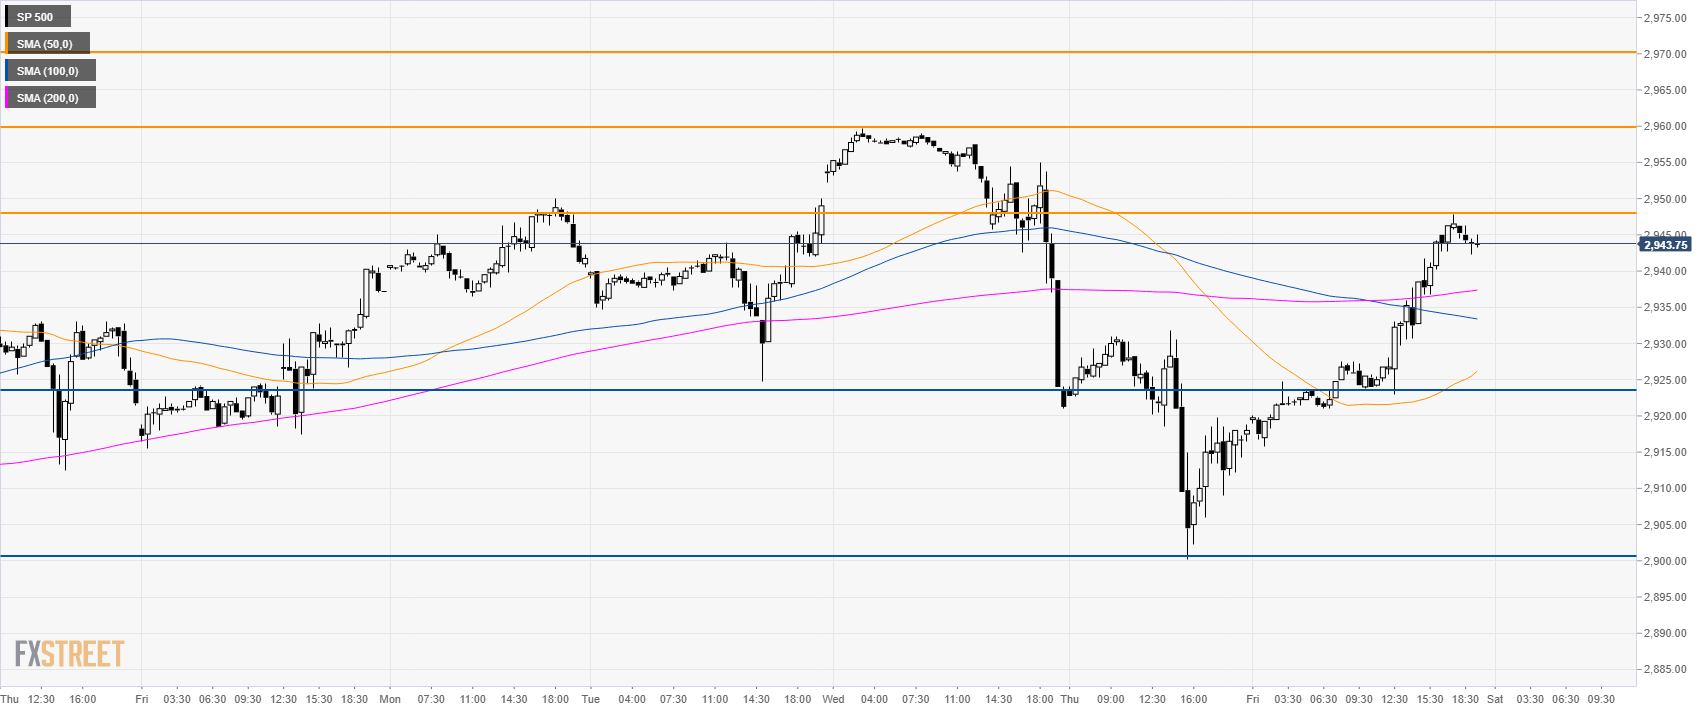
S&P500 30-minute chart
- The index is trading above its main SMAs suggesting bullish momentum in the short-term.
- The level to beat for bulls is 2,948.00 followed by the all-time high at 2,959.75 and 2,970.00.
- 2,948 can be a strong resistance and failure to breach it can lead the market back to 2,923.00 and 2900.00 support.
Additional key levels
