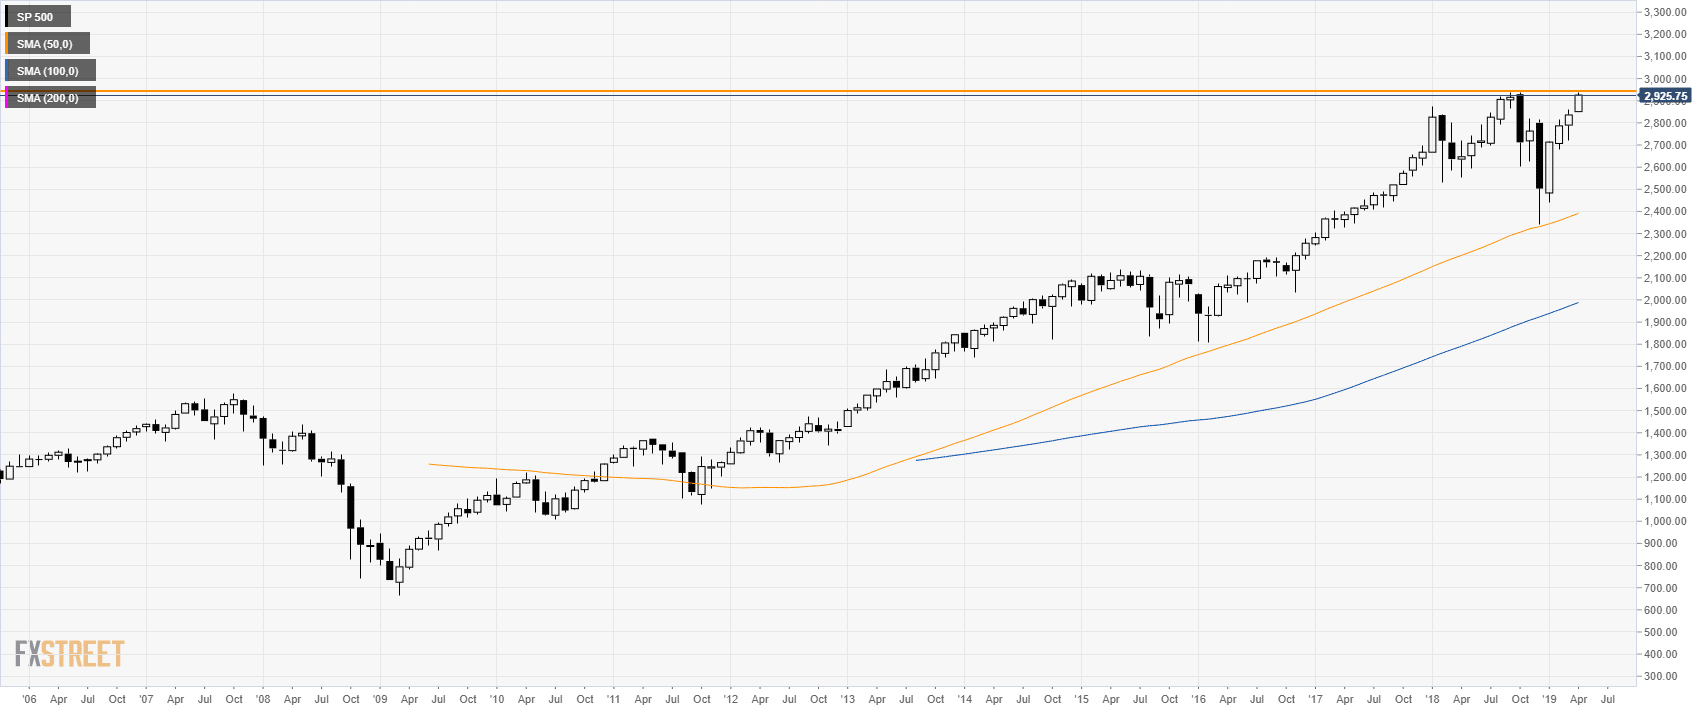
S&P 500 monthly chart
- The market is just trading below 2,935.50, the all-time high established in January this year.
- A break above the level would send the index in uncharted territory.
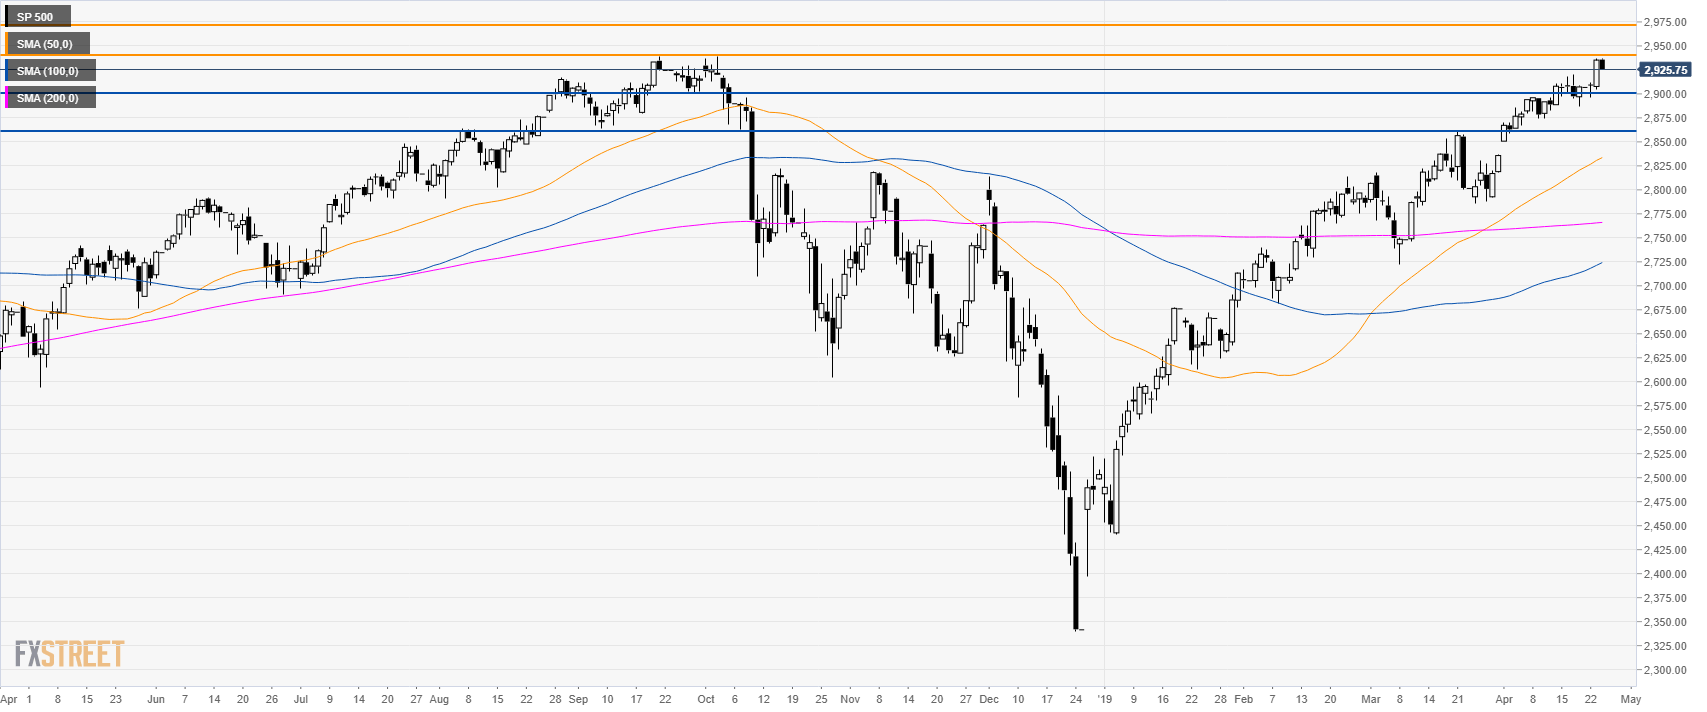
S&P500 daily chart
- If buyers break above 2,935.50 they would likely open the gates to 2,970.00 and the 3,000.00 psychological level.
- To the downside, support is seen at 2,900.00 and 2,860.00 level.
Additional key levels
