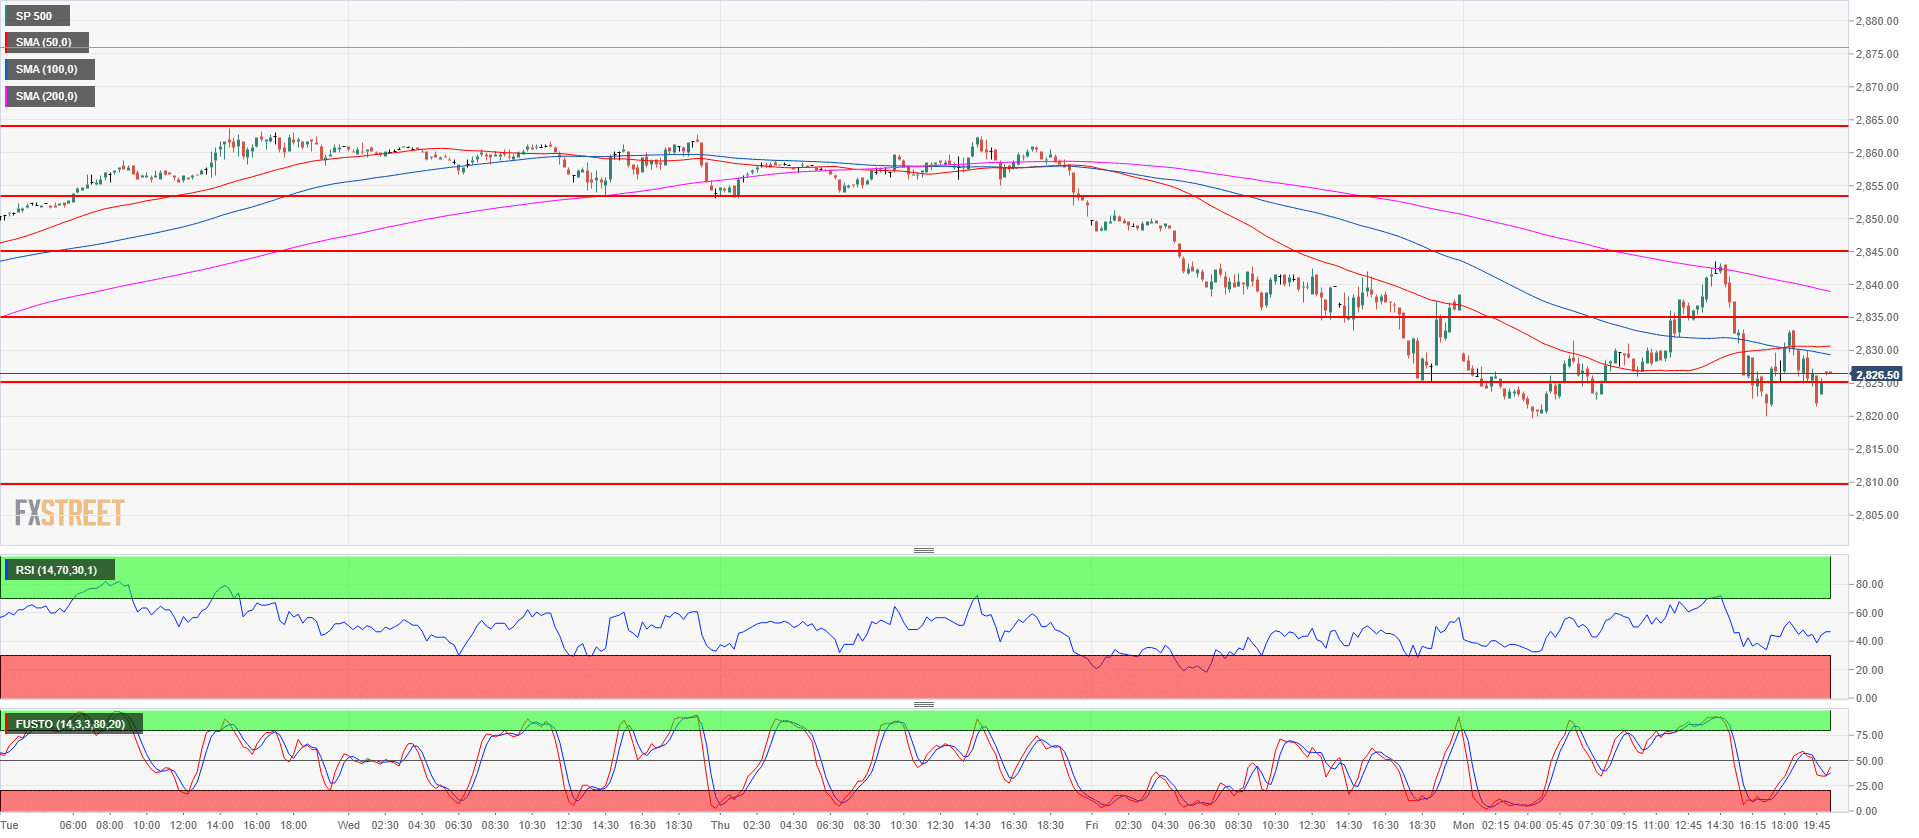
- The bulls tried to resume the bull trend on Monday but they were overwhelmed by bears at the 200-period simple moving average (15-minute chart) just below the 2,845.00 resistance.
- The main trend is bullish however in the short-term bears have taken the helm as they have been keeping the S&P500 Index in the red for the fourth consecutive day as well as broken below the trendline of a rising bearish wedge structure on the daily chart.
- If the bears are able to keep the current momentum going, the next scaling points to the downside are seen near 2,810.00 demand level and 2,798.50 July 30 low. On the flip side if the bulls manage to retake Monday’s high it would most likely indicate that bears are losing momentum and a retest of the August high would then enter into play.
S&P500 15-minute chart
S&P500 daily chart
-636697903025292729.png)
Spot rate: 2,826.00
Relative change: -0.43%
High: 2,843.50
Low: 2,819.75
Trend: Bullish
Short-term Trend: Bearish below 2,845.00
Resistance 1: 2,835.25 August 6 low
Resistance 2: 2,845.00 supply/demand level
Resistance 3: 2,853.00 August 9 low
Resistance 4: 2,863.75 August 7 high
Resistance 5: 2,875.50 all-time-high
Resistance 6: 2,900 figure
Support 1: 2,825.00 August 3 low
Support 2: 2,810.00 demand level
Support 3: 2,798.50 July 30 low
