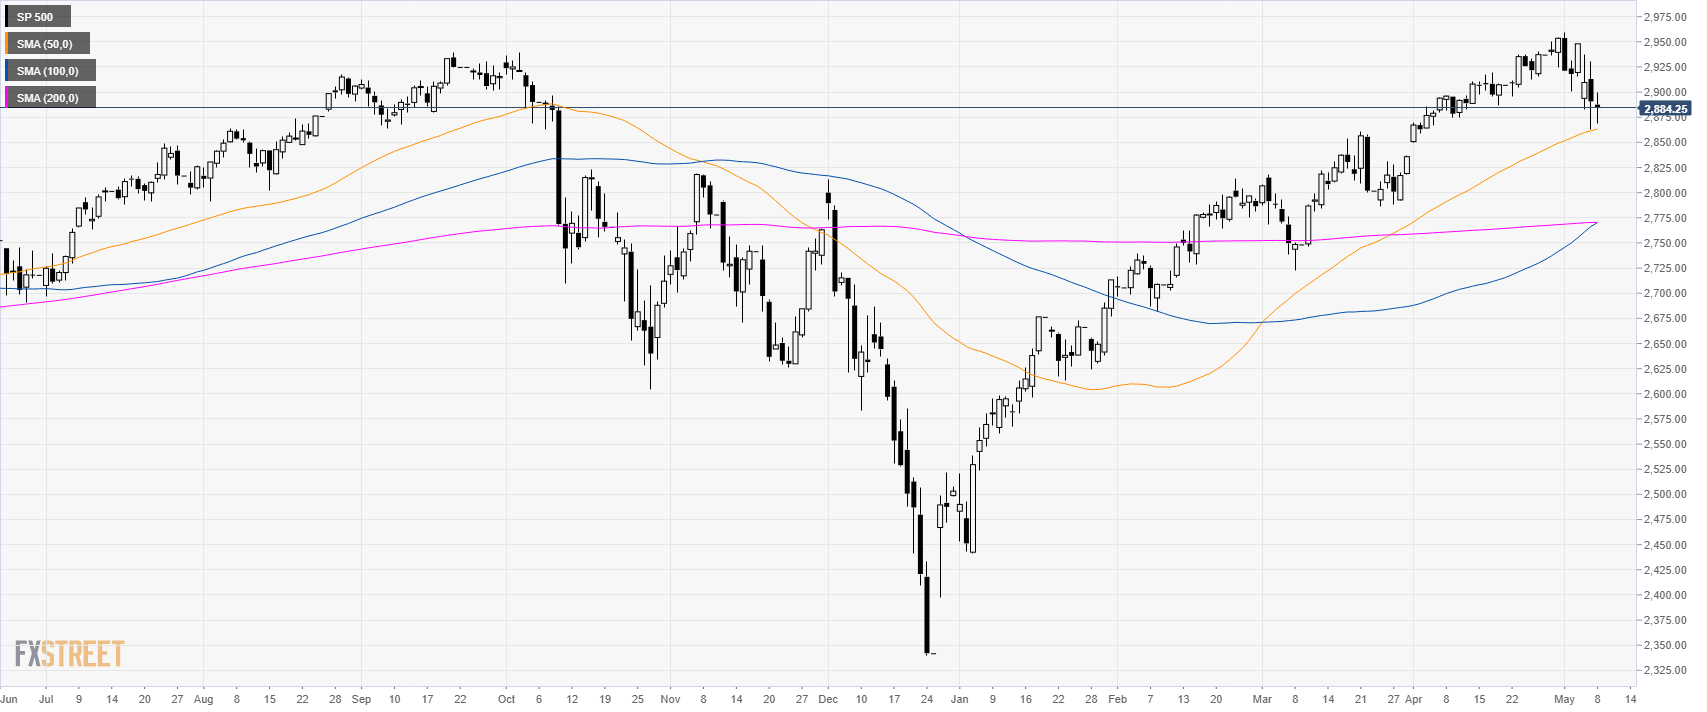
S&P500 daily chart
The S&P500 Index is trading in a bull trend above its main simple moving averages (SMAs). Bears kept the market below the 2,900.00 figure as the 50 SMA is supporting prices.
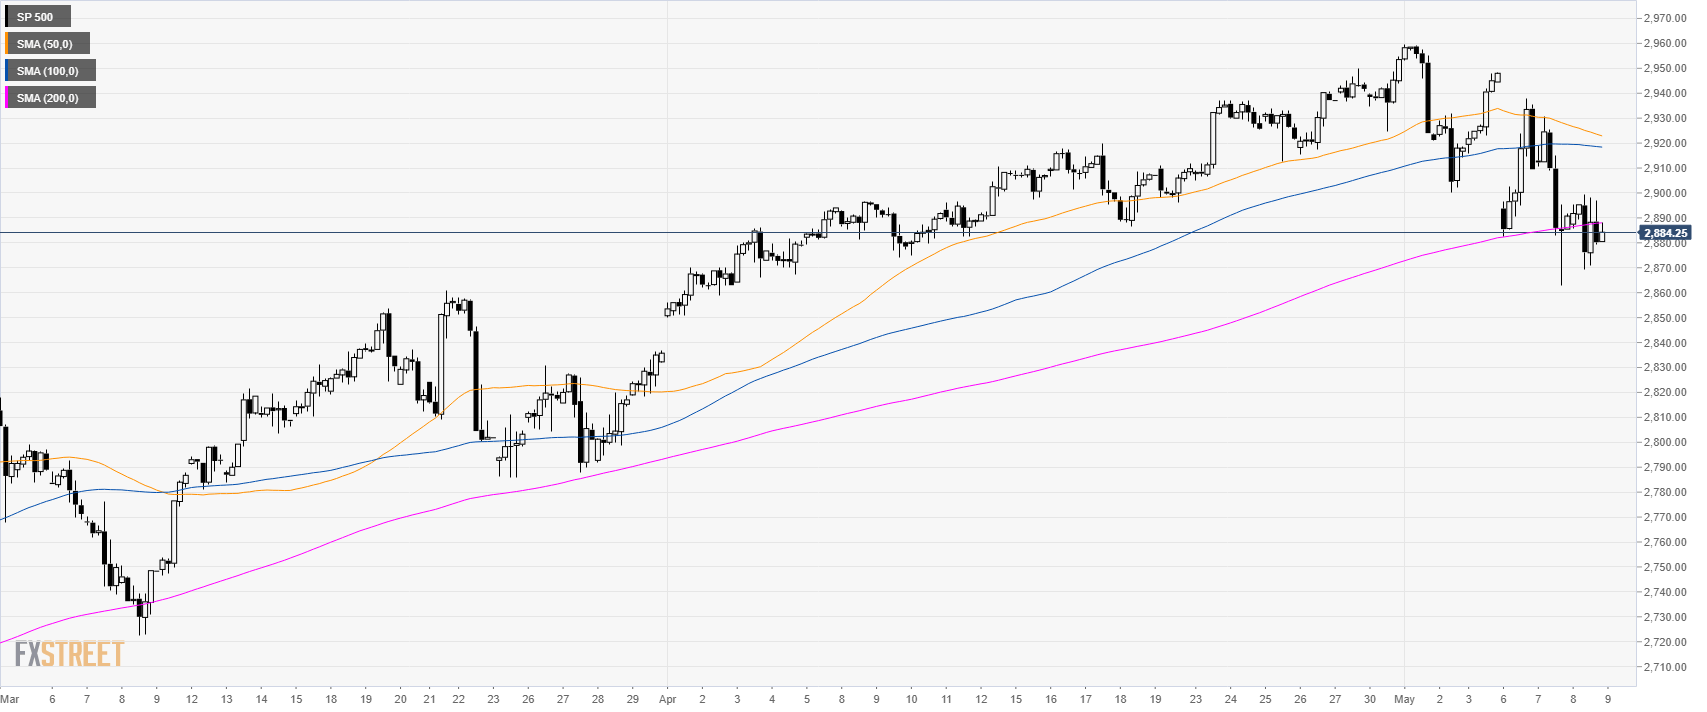
S&P500 4-hour chart
The market is trying to stabilize near the 200 SMA.

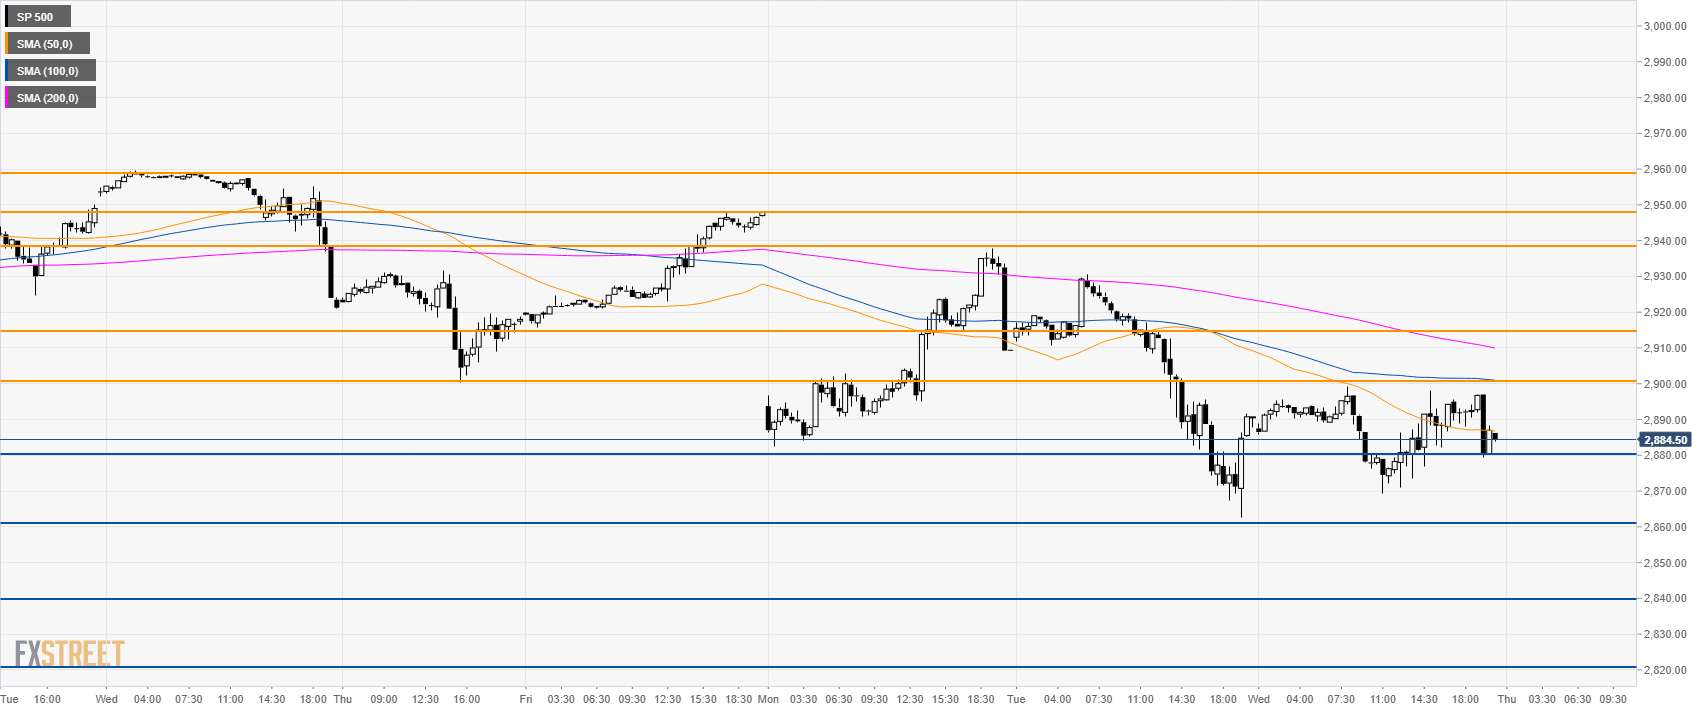
S&P500 30-minute chart
The bears didn’t make any progress this Wednesday. However, as the market is trading below the main SMAs the momentum is still tilted to the downside in the short term.
Bears need to break below 2,860.00 to reach 2,840.00 and 2,820.00 levels.
Resistance is to be expected at 2,900.00, 2,915 and 2,938.00 levels.
Additional key levels
