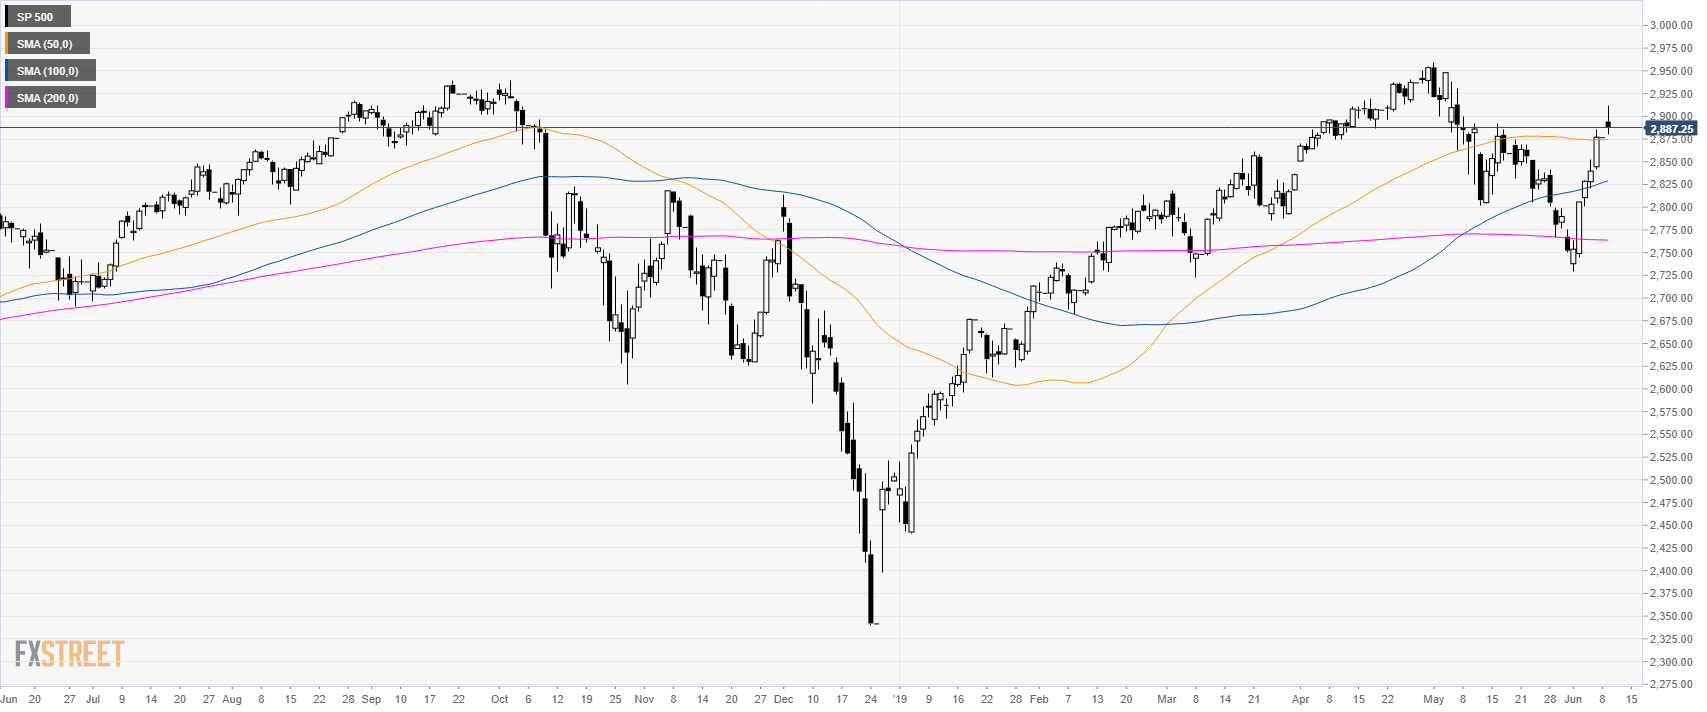
S&P500 daily chart
The S&P500 Index pushed beyond the 2900.00 mark on an intraday basis as the market trades above its main daily simple moving average (DSMA).
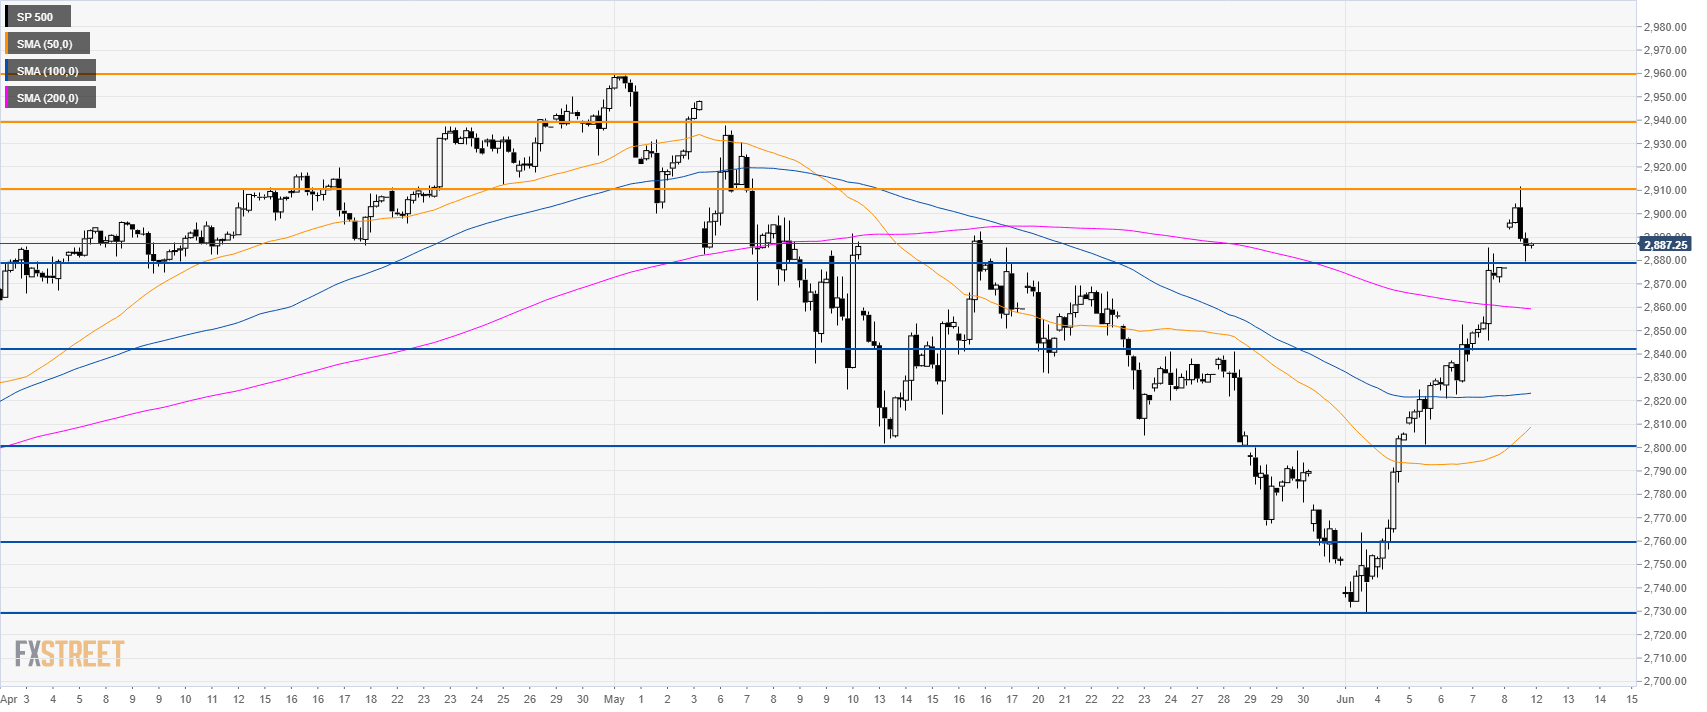
S&P500 4-hour chart
The index remains under heavy bullish pressure above its main SMAs. The level to beat for bulls is 2,910.00 which if broken can lead to 2,940.00 and 2,960.00. Immediate support is at 2,880.00 and 2,840.00.
Additional key levels
